Glacier National Park in Montana shares boundaries with Canada, an American Indian reservation, and a national forest. Along the North Fork of the Flathead River, the park also covers about 17, 000 acres of private lands that are currently used for ranching(牧场)and agriculture. This land is an important part of the habitat and migratory area in which several endangered species live. These private lands are essentially the only ones available for development in the region.
With encouragement from the park, local landowners initiated a land use planning effort to guide the future of the North Fork. The park is a partner in an inter local agreement that calls for resource-managing agencies to work together and with the more than 400 private owners in the area. A draft plan has been prepared, with objective of maintaining traditional economic uses but limiting new development that would damage park resources. Voluntary action by landowners, in cooperation with the park and the county, is helping to restrict small productions, maintain wildlife habitats, and minimize any harmful impact on the environment.
The willingness of local landowners to participate in this protection effort may have been stimulated by concerns that Congress would impose a legislative solution. Nevertheless, many local residents want to save the existing character of the area. Meetings between park officials and landowners have led to a dramatically improved understanding of all concerns.
1. The passage mainly discusses ________.| A.the endangered species in Glacier National Park |
| B.the protection of lands surrounding Glacier National Park |
| C.conservation laws imposed by the state of Montana |
| D.conservation laws imposed by Congress |
| A.They function as a hunting preserve. |
| B.They are restricted to government use. |
| C.They are heavily populated. |
| D.They contain natural habitats of threatened species. |
| A.indifferent | B.intimate |
| C.cooperative | D.disappointing |
| A.limit land development around the park |
| B.establish a new park in Montana |
| C.influence national legislation |
| D.settle border disputes with Canada |
相似题推荐
【推荐1】The world celebrates Earth Day every year on April 22. But one school in Potomac, Maryland tries to honor Earth Day every day. Very young children are learning about the environment and taking action to show their love for the Earth.
A child’s world is the world of playing. They love being outside in the open air, playing hide-and-seek, sliding and swinging on playground equipment. But children at St. James Children’s school also add to that fun by picking up rubbish in the school yard. Inside, they learn to save water and electricity. They also recycle and reuse the waste. And every spring they get the soil ready to plant flowers and vegetables in the school garden.
The children at St. James range from six weeks to six years old. The environmental study begins at age two. Rebecca Boker teaches the children the importance of inking care of the Earth. Boker says every day at St, James is Earth Day. She mentioned some books, which contain Materials that ask children to do something to help the environment and protect the Earth.
In St. James, children observe (观察) the growth of plants from seeds to sprouts in cups kept in the classroom. Then they watch the plants continue to grow after placing then in the garden. The students also observe the life cycle of insect. After that, they know it is their job to respect the Earth just like they want others to respect their home.
But do these young children really get the message that their teachers try to communicate? Ms. Boker says yes. A few days later, the kids at St. James will go out to the school garden for the yearly clean-up. But for them, Earth Day will continue for the School days ahead as well.
1. The children at St. James Children’s School ______.| A.learn to save water and electricity at home |
| B.often go out to pick up rubbish in the street |
| C.are not allowed to use playground equipment |
| D.can help prepare the soil to plant flowers and vegetables |
| A.teach the children the importance of respecting the Earth |
| B.enrich the children’s knowledge of agriculture |
| C.help the children write better reports |
| D.let the children enjoy the growth of life |
| A.Unconcerned. | B.Anxious. |
| C.Unsatisfied. | D.Positive. |
| A.The celebration of Earth Day in schools |
| B.The protection of the environment |
| C.Earth Day at St. James Children’s School |
| D.Children’s love and respect for life |
【推荐2】New bio-plastics are being made in laboratories from straw, wood chips and food waste, with researchers aiming to replace oil as the source of the world’s plastic.
The new approaches include genetically modifying bacteria to eat wood and produce useful chemicals. But the bio-plastics are currently significantly more expensive to make than fossil fuel-based plastics.
Land and seas around the world, from high mountains to deep oceans, have become polluted with plastic, prompting major public concern. The world has produced 8bn tons of plastic since the 1950s and demand is still rising.
While some waste plastic is recycled, much of it is burnt to produce electricity, resulting in carbon emissions that drive climate change. In contrast to plastic made from oil, plastics made from plant-based materials only release the carbon the plants absorbed from the air as they grew. Bio-plastics will also give more options for products that biodegrade (生物降解) in the environment, although they can be made very long-lasting if required.
“Plastics are an incredible enhancement to our daily lives,” said Paul Mines, CEO of Biome Technologies in the UK, which has spent t5m in the last five years on bio-plastics research. “But we can’t go on using fossil fuel-based materials. About 6-7% of every barrel (桶) of oil is used to make plastics.”
“Using plant materials is feasible,” said professor Simon, at the University of York. “Replacing half of the nation’s plastic bottles could be done using just 3% of the sugar beet crop, 5% of wheat straw or 2.5% of food waste,” he said.
Currently, just a few thousand tons of bio-plastic are used in the UK each year, compared to millions of tons of conventional plastic. Mines said this could rise to about 20,000 tons in the next five years.
1. Why are high mountains and deep oceans mentioned in Paragraph 3?| A.To display the range of plastic pollution. | B.To show the widespread use of plastic. |
| C.To present a reason of wide use of plastic. | D.To stress the increasing demand for plastic. |
| A.Producing electricity. | B.Being eco-friendly. |
| C.Driving climate change. | D.Biodegrading other plastic. |
| A.Possible. | B.Troublesome. | C.Original. | D.Costly. |
| A.Plastics arc necessary in daily life. | B.Oil is the source of the world’s plastic. |
| C.Bioplastic making is a promising industry. | D.Scientists are researching bioplastic making. |
【推荐3】The destruction of tropical forests is happening at an alarming rate to make way for crops. After these lands are short of nutrients they’re abandoned, which can lead to the natural regrowth of the forest that was once there. The finding suggests that so-called recovered forests, also known as secondary forests, could play a key role in restoring ecosystems.
To better understand this process, Lourens Poorter at Wageningen University and Research in the Netherlands and his colleagues analyzed 77 secondary forest sites across the tropical regions of Central and South America, and in West Africa. These sites were all at various stages of regrowth —for example, some were 20 years old, and others were 120.
The team contrasted each secondary forest with nearby old-growth forest—forests that haven’t had major disturbance. The more similar the secondary forests were to their neighboring old-growth forests, reasoned the researchers, the more they had recovered.
The team found that after 20 years, the average secondary forest that had grown from farmland that was used with low to medium intensity (强度) had recovered 78% of old-growth forest attributes (属性). “It goes way faster than we thought,” says Poorter.
But the researchers found significant discrepancy between the recovery time for the different forest attributes. Soils were the quickest to bounce back, with most recovery happening within 10 years. It took 25 — 60 years for plant species diversity to recover.
Despite the enormous amount of deforestation that has and continues to occur, there’s hope that these forests can bounce back naturally, says Poorter. Secondary forests currently make up over 28% of tropical forests in Central and South America, and are important for locking up carbon which is important to deal with climate change.In addition, they attract mammals, birds and insects back to the area, which is important for ecosystem restoration.
“These results are promising,” says J. Leighton Reid at Virginia Tech. “However, the sites in this study don’t represent regeneration on the average piece of deforested land, and many deforested sites will recover much more slowly than the ones studied here.”
1. Why did the researchers contrast secondary forests with nearby old-growth forests?| A.To measure the recovery of secondary forests. |
| B.To detect threats to secondary forests. |
| C.To learn more about forest attributes. |
| D.To determine the contributing factors of forest recovery. |
| A.Link. | B.Dependence. | C.Difference. | D.Similarity. |
| A.Fewer tropical forests are being deforested. |
| B.Ecosystem restoration is happening in forests. |
| C.The survey covers a representative sample of sites. |
| D.A quarter of America is covered by secondary forests. |
| A.They went hand in hand with the ecosystem restoration. |
| B.They featured secondary forests that could recover themselves. |
| C.They could re-establish themselves quickly on abandoned land. |
| D.They were often abandoned after being deforested for agriculture. |
Graph can be a very useful tool for conveying information especially numbers, percentages, and other data . A graph gives the reader a picture to interpret. That can be a lot more pages and pages and pages explaining the data .
Graphs can seem frightening, but reading a graph is a lot like reading a story. The graph has a title ,a main idea ,and supporting details .You can use your active reading skills to analyze and understand graphs just like any other text .
Most graphs have a few basic parts: a caption or introduction paragraph, a title , a legend or key, and labeled axes. An active reader looks at each part of the graph before trying to interpret the data. Captions will usually tell you where the data came from (for example, a scientific study of 400 African elephants from 1980 to 2005). Captions usually summarize the author's main point as well. The title is very important. It tells you the main idea of the graph by stating what kind of information is being shown. A legend, also called a key ,is a guide to the symbols and colors used in the graph. Many graphs, including bar graphs and line graphs, have two axes that form a corner, Usually these axes are the left side and the bottom of the graph .Each axis will always have a label. The label tells you what each axis measures.
Bar Graphs
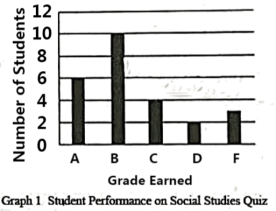
A bar graph has two axes and uses bars to show amounts. In Graph 1 ,we see that the x-axis shows grades that students earned, and the y-axis shows bow many students earned each grade .You can see that 6 students earned an A because the bar for A stretches up to 6 on the vertical measurement. There is a lot of information we can get from a simple graph like this(See Graph 1).
Line Graphs
A line graph looks similar to a bar graph ,but instead of Bars, it plots points and connects them with a line .It has the same parts as a bar graph – two labeled axes –and can be read the same way .To read a line graph, it’s important to focus on the points of intersection rather than the line segments between the points, This type of graph is most commonly used to show how something changes over time.
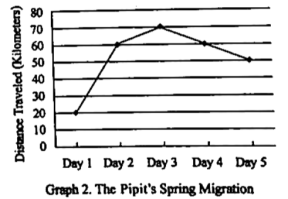
Here is a graph that charts how far a bird flies during the first Five days of its spring migration (See Graph 2).
The unit of measurement for the x-axis is days. The unit of measurement for the y-axis is kilometers. Thus we can see that ,on the first day, the pipit flew 20 kilometers. The line segment goes up between Day 1 and Day 2,which means that the bird flew farther on Day 2.If the line segment angled dawn, as between Day 4 and Day 5,it would mean that the bird flew fewer kilometers than the day before. This line graph is a quick, visual way to tell the reader about the bird’s migration.
Pie Graphs

A typical pie graph looks like a circular pie. The circle is divided into sections, and each section represents a fraction of the data. The graph is commonly used to show percentages; the whole pie represents l00 percent, so each piece is a fraction of the whole.
A pie graph might include a legend,or it might use icons or labels within each slice. This pie graph shows on month’s expense, (See Graph 3 ).
Food $ 25
Movies $ 12
Clothing $ 36
Savings $ 20
Books $ 7
1. When used in a graph,a legend is_____
| A.a guide to the symbols and colors |
| B.an introduction paragraph |
| C.the main idea |
| D.the data |
| A.4. | B.6. | C.10. | D.20 . |
| A.Day 1 | B.Day 2 | C.Day 3 | D.Day 4 |
| A.Food. | B.Books | C.Movies | D.Clothing. |
【推荐2】The Internal Business Machines Corporation, known as IBM, says it is making technology for precision weather predictions available to everyone. The company said the new weather forecasts offer more details and bring a level of accuracy once available only in major industrial countries. The forecasting tool is expected to help emergency officials better predict where severe storms will hit. It may also aid airline companies to plan flight paths, as well as farmers to care for crops.
The new system creates weather forecasts more often and with finer details than what is available outside the United States, Europe and Japan. Most forecasts have a resolution (分辨率) of 10 to 15 square kilometers and provide new information every six to twelve hours. IBM’s Global High-Resolution Atmospheric Forecasting System goes down to three square kilometers and provides information every hour.
Fred Carr is a famous climatology (气候学) professor at the University of Oklahoma and was not involved in the project. Carr said the United States has a similar high-resolution forecasting system, “but it’s just for the U.S. because it takes so much computer time. To do it for the whole globe is a pretty important achievement.” Carr added that it is possible to quickly collect observations from radar, airplanes and surface measurements in the United States. But he said it is not clear how IBM gets information from the other 98% of the world. Carr said he believes there will be problems in getting information, so “sometimes those forecasts aren’t going to be very accurate”. Users will be able to decide for themselves. The system now operates on the Weathers.com website and The Weather Channel’s application program for smartphones.
In the future, IBM hopes to improve its forecasts by collecting information from atmospheric pressure sensors used in such phones. The sensors improve the precision of global positioning system, or GPS, technology. For example, they can help fitness tracking instruments measure how many steps a user has taken. IBM said it is not currently using this information but plans to offer users the chance to choose it. Some privacy activists and governments have criticized technology companies for gathering this kind of information. The city of Los Angeles, California has brought a case against IBM for improperly using location information from Weather Channel app users.
1. What is special about IBM’s new forecasting system?| A.It offers a level of accuracy that has never previously existed. |
| B.It has some functions that other systems don’t have. |
| C.It is specially designed to help airline companies. |
| D.It updates more frequently than most systems. |
| A.Taking up too much computer time. | B.Making it universally usable across the whole globe. |
| C.Acquiring detailed forecasting information. | D.Lacking the tools to collect observations. |
| A.installing atmospheric pressure sensors in user’s phones. |
| B.offering users the chance to choose different apps. |
| C.making use of GPS technology unreasonably. |
| D.collecting users’ location information. |
| A.The Spread of IBM’s New Forecasting Technology |
| B.Better Weather Predictions Coming to the Developing World |
| C.IBM’s New Forecasting System Has Unique Advantages |
| D.IBM Still Has a Long Way to Go to Develop Its Forecasting System |
A Different Type of Phone Book
Although books are still popular with teenagers, most of them spend more of their leisure time staring at their phone than reading a paperback. And the more versatile phones become, the more reasons young people have for looking at them.
Although the idea originated in Japan, cell phone novels have also sprung up in the rest of East Asia, Europe and Africa. Many are written by high school or university students who are very familiar with the topics that teenagers are interested in. Common themes are love, tragedy and betrayal, and the stories often deal with difficult or controversial issues. Twenty-one-year-old Rin said that she started her novel If You during her final year at high school and explained that was the tragic love story of two childhood friends.
Rin wrote her novel over a six-month period in spare moments, often while commuting on the train.
The style of cell phone novels has evolved to suit the medium. Chapters have no more than 200 words, and often just 50-100 words.
In 2009, a young Japanese writer called Takatsu, who lives in Canada, began writing the first English language cell phone novel, Secondhand Memories. Each instalment appeared on textnovel.com, a website dedicated to cell phone stories. Takatsu had read an English translation of Rin’s story If You and had been impressed by its simple and emotional language. It was a feature he deliberately copied when he started writing Secondhand Memories.
| A.Books are sometimes regarded as old-fashioned and difficult to read. |
| B.In response to this trend, some smart young authors have changed the way they write. |
| C.However, as the story progressed, the style gradually evolved into something different. |
| D.She typed out installments on her phone and uploaded them onto a popular website for cell phone authors. |
| E.No money is made from cell phone novels unless they are published as books. |
| F.Sentences are short and there are no descriptions of anything or anybody because there isn’t space. |


