解题方法
1 . 某公司近5年产品研发年投资额 (单位:百万元)与年销售量
 (单位:千件)的数据统计表如下:
(1)根据上表数据画出年投资额与年销售量的散点图; 作为年销售量关于年投资额的回归分析模型,并对年销售量取对数,得到如下数据表:
请根据表格数据、参考数据和公式,求出该非线性经验回归方程.
参考数据与公式: ;对于一组数据
 ,
, ,…,
,…, ,其经验回归直线
 的斜率和截距的最小二乘法估计公式分别为
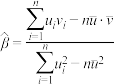 ,
, .
.
(单位:百万元)与年销售量(单位:千件)的数据统计表如下:年投资额 | 1 | 2 | 3 | 4 | 5 |
年销售量 | 0.5 | 1 | 1.5 | 3 | 5.5 |
与年销售量的散点图;
作为年销售量关于年投资额的回归分析模型,并对年销售量取对数,得到如下数据表:年销售量 | 0.5 | 1 | 1.5 | 3 | 5.5 |
|
| 0 | 0.4 | 1.1 | 1.7 |


参考数据与公式:
;对于一组数据,,…,,其经验回归直线的斜率和截距的最小二乘法估计公式分别为,.
您最近一年使用:0次


