解题方法
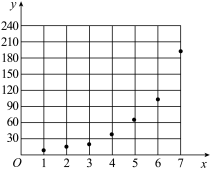
1 . 近年来,共享单车进驻城市,促进绿色出行引领时尚先锋.某公司计划对未开通共享单车的A县城进行车辆投放,为了确定车辆投放量,对过去在其他县城的投放量情况以及年使用人次进行了统计,得到了投放量x(单位:千辆)与年使用人次y(单位:千次)的数据如下表所示.
(1)根据数据绘制投放量x与年使用人次y的散点图如图所示,观察散点图可知,两个变量不具有线性相关关系,拟用对数函数模型 或指数函数模型
 (
( ,
, )对两个变量的关系进行拟合,请问哪个模型更适宜作为投放量x与年使用人次y的回归方程类型(给出判断即可,不必说明理由),并求出y关于x的回归方程;
(2)根据(1)中求得的回归方程,求此回归模型投放量为5千辆时的残差 .
.
参考数据:
其中 ,
, ,取
,取 ,
, .
.
参考公式:对于一组数据 ,
, ,…,
,…, ,其回归直线
 的斜率和截距的最小二乘估计公式分别为
 ,
, .
.
| x | 1 | 2 | 3 | 4 | 5 | 6 | 7 |
| y | 7 | 12 | 22 | 35 | 67 | 102 | 197 |
或指数函数模型(,)对两个变量的关系进行拟合,请问哪个模型更适宜作为投放量x与年使用人次y的回归方程类型(给出判断即可,不必说明理由),并求出y关于x的回归方程;(2)根据(1)中求得的回归方程,求此回归模型投放量为5千辆时的残差
.参考数据:
 |  |  |  |
| 63.14 | 1.56 | 2563 | 50.45 |
,,取,.参考公式:对于一组数据
,,…,,其回归直线的斜率和截距的最小二乘估计公式分别为,.
您最近一年使用:0次
2021-03-28更新
|
73次组卷
|
2卷引用:山西省2020-2021学年高二下学期3月联合考试数学(文)试题
名校
2 . 红铃虫是棉花的主要害虫之一,能对农作物造成严重伤害.每只红铃虫的平均产卵数y(个)和平均温度x(℃)有关,现收集了7组数据,得到下面的散点图及一些统计量的值. 与
与 (其中e为自然对数的底数)哪一个更适合作为平均产卵数y(个)关于平均温度
 (℃)的回归方程类型?(给出判断即可,不必说明理由)并由判断结果及表中数据,求出
 关于的回归方程;
附:回归方程 中,
中,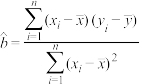 .
.
(2)现在有10根棉花纤维,其中有6根为长纤维,4根为短纤维,从中随机抽取3根棉花纤维,设抽到的长纤维棉花的根数为X,求X的分布列.
与(其中e为自然对数的底数)哪一个更适合作为平均产卵数y(个)关于平均温度(℃)的回归方程类型?(给出判断即可,不必说明理由)并由判断结果及表中数据,求出关于的回归方程;附:回归方程
中,.参考数据 | |||||
|
|
|
|
|
|
5215 | 2347.3 | 33.6 | 27 | 81.3 | 3.6 |


您最近一年使用:0次
名校
3 . 某公司为了研究年宣传费(单位:千元)对销售量(单位:吨)和年利润 (单位:千元)的影响,搜集了近 8 年的年宣传费
 和年销售量
和年销售量 数据:
数据:
(1)请补齐表格中 8 组数据的散点图,并判断 与
与 中哪一个更适宜作为年销售量关于年宣传费的函数表达式?(给出判断即可,不必说明理由)

(2)若(1)中的 ,且产品的年利润与,的关系为
 ,为使年利润值最大,投入的年宣传费应为何值?
(单位:千元)对销售量(单位:吨)和年利润(单位:千元)的影响,搜集了近 8 年的年宣传费和年销售量数据: | 1 | 2 | 3 | 4 | 5 | 6 | 7 | 8 |
| 38 | 40 | 44 | 46 | 48 | 50 | 52 | 56 |
| 45 | 55 | 61 | 63 | 65 | 66 | 67 | 68 |
(1)请补齐表格中 8 组数据的散点图,并判断
与中哪一个更适宜作为年销售量关于年宣传费的函数表达式?(给出判断即可,不必说明理由)(2)若(1)中的
,且产品的年利润与,的关系为,为使年利润值最大,投入的年宣传费应为何值?
您最近一年使用:0次
2018-02-11更新
|
215次组卷
|
2卷引用:福建省泉州市2017-2018学年高一上学期期末考试数学试题
4 . 某企业生产一种产品,从流水线上随机抽取100件产品,统计其质量指标值并绘制频率分布直方图(如图):
销售时质量指标值在 的产品每件亏损1元,在
 的产品每件盈利3元,在
 产品每件盈利5元.
(1)求每件产品的平均销售利润;
(2)该企业为了解年营销费用(单位:万元)对年销售量(单位:万件)的影响,对近5年年营销费用和年销售量 数据做了初步处理,得到如图的散点图及一些统计量的值.
表中 根据散点图判断,
 可以作为年销售量(万件)关于年营销费用(万元)的回归方程.

①求关于的回归方程;
②用所求的回归方程估计该企业应投入多少年营销费,才能使得该企业的年收益的预报值达到最大?(收益=销售利润营销费用,取 )
)
附:对于一组数据 其回归直线
其回归直线 均斜率和截距的最小二乘估计分别为
 .
.
| 质量指标值分组 | |  |  |  | |
| 频数 | 5 | 20 | 40 | 25 | 10 |
的产品每件亏损1元,在的产品每件盈利3元,在产品每件盈利5元. (1)求每件产品的平均销售利润;
(2)该企业为了解年营销费用
(单位:万元)对年销售量(单位:万件)的影响,对近5年年营销费用和年销售量数据做了初步处理,得到如图的散点图及一些统计量的值.  |  |  |  |
| 16.30 | 23.20 | 0.81 | 1.62 |
根据散点图判断,可以作为年销售量(万件)关于年营销费用(万元)的回归方程. ①求
关于的回归方程; ②用所求的回归方程估计该企业应投入多少年营销费,才能使得该企业的年收益的预报值达到最大?(收益=销售利润营销费用,取
)附:对于一组数据
其回归直线均斜率和截距的最小二乘估计分别为.
您最近一年使用:0次
名校
5 . 下列结论正确的是__________ .①在某项测量中,测量结果 服从正态分布
 .若在
.若在 内取值的概率为0.35,则在
 内取值的概率为0.7;②以模型
 去拟合一组数据时,为了求出回归方程,设
 ,其变换后得到线性回归方程
 ,则
,则 ;③已知命题“若函数
 在
在 上是增函数,则
 ”的逆否命题是“若
 ,则函数在上是减函数”是真命题;④设常数
 ,则不等式
,则不等式 对
对 恒成立的充要条件是
 .
.
服从正态分布.若在内取值的概率为0.35,则在内取值的概率为0.7;②以模型去拟合一组数据时,为了求出回归方程,设,其变换后得到线性回归方程,则;③已知命题“若函数在上是增函数,则”的逆否命题是“若,则函数在上是减函数”是真命题;④设常数,则不等式对恒成立的充要条件是.
您最近一年使用:0次
2016-12-05更新
|
300次组卷
|
2卷引用:2017届甘肃高台县一中高三上第三次检测理数试卷
解题方法
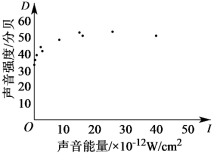
6 . 噪声污染已经成为影响人们身体健康和生活质量的严重问题,为了了解强度 (单位:分贝)与声音能量
 (单位:
(单位: )之间的关系,将测量得到的声音强度
 和声音能量
和声音能量 (
( 、
、 、…、
、…、 )数据作了初步处理,得到下面的散点图及一些统计量的值.
表中 ,
, .
.
(1)根据表中数据,求声音强度关于声音能量的回归方程 ;
;
(2)当声音强度大于 分贝时属于噪音,会产生噪声污染,城市中某点
 共受到两个声源的影响,这两个声源的声音能量分别是
 和
和 ,且
,且 .已知点的声音能量等于声音能量与之和,请根据(1)中的回归方程,判断点是否受到噪声污染的干扰,并说明理由.
附:对于一组数据 ,
, ,……,
,……, ,其回归直线
 的斜率和截距的最小二乘估计分别为:
 ,
, .
.
(单位:分贝)与声音能量(单位:)之间的关系,将测量得到的声音强度和声音能量(、、…、)数据作了初步处理,得到下面的散点图及一些统计量的值. |  |  |  |  |  |  |
 |  |  |  |  |  |  |
,.(1)根据表中数据,求声音强度
关于声音能量的回归方程;(2)当声音强度大于
分贝时属于噪音,会产生噪声污染,城市中某点共受到两个声源的影响,这两个声源的声音能量分别是和,且.已知点的声音能量等于声音能量与之和,请根据(1)中的回归方程,判断点是否受到噪声污染的干扰,并说明理由.附:对于一组数据
,,……,,其回归直线的斜率和截距的最小二乘估计分别为:,.
您最近一年使用:0次
2020高三·全国·专题练习
7 . 某厂生产不同规格的一种产品,根据检测标准,其合格产品的质量y(g)与尺寸x(mm)之间近似满足关系式 ,c为大于0的常数).按照某项指标测定,当产品质量与尺寸的比在区间
 内时为优等品.现随机抽取6件合格产品,测得数据如下:
(1)现从抽取的6件合格产品中再任选3件,记ξ为取到优等品的件数,试求随机变量ξ的分布列和期望;
(2)根据测得数据作了初步处理,得相关统计量的值如下表:
根据所给统计量,求y关于x的回归方程.
附:对于样本 ,其回归直线
 的斜率和截距的最小二乘估计公式分别为:
,c为大于0的常数).按照某项指标测定,当产品质量与尺寸的比在区间内时为优等品.现随机抽取6件合格产品,测得数据如下:尺寸 | 38 | 48 | 58 | 68 | 78 | 88 |
质量 | 16.8 | 18.8 | 20.7 | 22.4 | 24 | 25.5 |
质量与尺寸的比 | 0.442 | 0.392 | 0.357 | 0.329 | 0.308 | 0.290 |
(1)现从抽取的6件合格产品中再任选3件,记ξ为取到优等品的件数,试求随机变量ξ的分布列和期望;
(2)根据测得数据作了初步处理,得相关统计量的值如下表:
 |  |  |  |
| 75.3 | 24.6 | 18.3 | 101.4 |
根据所给统计量,求y关于x的回归方程.
附:对于样本
,其回归直线的斜率和截距的最小二乘估计公式分别为:
您最近一年使用:0次
8 . 新冠肺炎疫情发生以来,我国某科研机构开展应急科研攻关,研制了一种新型冠状病毒疫苗,并已进入二期临床试验.根据普遍规律,志愿者接种疫苗后体内会产生抗体,人体中检测到抗体,说明有抵御病毒的能力.通过检测,用表示注射疫苗后的天数,表示人体中抗体含量水平(单位: ,即:百万国际单位/毫升),现测得某志愿者的相关数据如下表所示:
根据以上数据,绘制了散点图.与(a,b,c,d均为大于0的实数)哪一个更适宜作为描述y与x关系的回归方程类型?(给出判断即可,不必说明理由)
(2)根据(1)的判断结果求出y关于x的回归方程,并预测该志愿者在注射疫苗后的第10天的抗体含量水平值;
(3)从这位志愿者的前6天的检测数据中随机抽取4天的数据作进一步的分析,记其中的y值大于50的天数为X,求X的分布列与数学期望.
参考数据:
其中 .参考公式:用最小二乘法求经过点,,
 ,
, ,
, 的线性回归方程
 的系数公式,
 ;
; .
.
表示注射疫苗后的天数,表示人体中抗体含量水平(单位:,即:百万国际单位/毫升),现测得某志愿者的相关数据如下表所示:| 天数 | 1 | 2 | 3 | 4 | 5 | 6 |
| 抗体含量水平 | 5 | 10 | 26 | 50 | 96 | 195 |
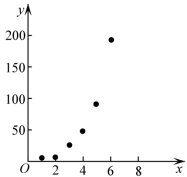
与(a,b,c,d均为大于0的实数)哪一个更适宜作为描述y与x关系的回归方程类型?(给出判断即可,不必说明理由)(2)根据(1)的判断结果求出y关于x的回归方程,并预测该志愿者在注射疫苗后的第10天的抗体含量水平值;
(3)从这位志愿者的前6天的检测数据中随机抽取4天的数据作进一步的分析,记其中的y值大于50的天数为X,求X的分布列与数学期望.
参考数据:
 |  |  |  |  |  |  |  |
| 3.50 | 63.67 | 3.49 | 17.50 | 9.49 | 12.95 | 519.01 | 4023.87 |
.参考公式:用最小二乘法求经过点,,,,的线性回归方程的系数公式,;.
您最近一年使用:0次
名校
9 . 下列命题错误的是( )
A.线性相关模型中,决定系数 越大相关性越强,相关系数 越大相关性越强,相关系数 越大相关性也越强 越大相关性也越强 |
B.回归直线至少会经过其中一个样本点 |
C.已知一系列样本点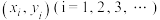 的经验回归方程为 的经验回归方程为 ,若样本点 ,若样本点 与 与 的残差相等,则 的残差相等,则 |
D.以 模型去拟合某组数据时,为了求出回归方程,设 模型去拟合某组数据时,为了求出回归方程,设 ,将其变换后得到线性方程 ,将其变换后得到线性方程 ,则 ,则 的值分别为3,4 的值分别为3,4 |
您最近一年使用:0次
名校
解题方法
10 . 某市旅游局通过文旅度假项目考察后,在“五一”期间推出了多个具体项目,销售火爆.其中乡村旅游项目推出了六条经典路线,六款不同价位的套票与相应价格x的数据如下表.
经数据分析、描点绘图,发现价格x与购买人数y近似满足关系式: ,对上述数据进行初步处理,其中
 .
.
附:①参考数据: ;
;
②对于一组数据 ,其回归直线
 的斜率和截距的最小二乘估计值分别为
 .
.
(1)根据所给数据,求y关于x的回归方程;
(2)为进一步优化旅游方面的投资,相关部门在“五一”期间随机调查了200位旅游者,以了解不同年龄段的旅游者对不同项目的关注情况,得到如下信息表:
问是否有 以上的把握认为关注的旅游项目与年龄段有关,并说明理由.
附:
| 旅游线路 | 奇山秀水游 | 古村落游 | 慢生活游 | 亲子游 | 采摘游 | 舌尖之旅 |
| 套票型号 | A | B | C | D | E | F |
| 价格x/元 | 39 | 49 | 58 | 67 | 77 | 86 |
,对上述数据进行初步处理,其中.附:①参考数据:
;②对于一组数据
,其回归直线的斜率和截距的最小二乘估计值分别为.(1)根据所给数据,求y关于x的回归方程;
(2)为进一步优化旅游方面的投资,相关部门在“五一”期间随机调查了200位旅游者,以了解不同年龄段的旅游者对不同项目的关注情况,得到如下信息表:
| 50岁以上 | 50岁以下 | |
关注 | 80人 | 40人 |
关注 | 40人 | 40人 |
以上的把握认为关注的旅游项目与年龄段有关,并说明理由.附:
 | 0.100 | 0.050 | 0.025 | 0.010 | 0.001 |
 | 2.706 | 3.841 | 5.024 | 6.635 | 10.828 |
您最近一年使用:0次


