从某大学随机选择
名女大学生,其身高和体重数据如表所示:
根据表中的数据可得回归直线方程
,
,这表明女大学生的体重差异有______ 是由身高引起的.
![](https://staticzujuan.xkw.com/quesimg/Upload/formula/cd3304e23f3b0f9569c4140ca89b6498.png)
身高![]() | ![]() | ![]() | ![]() | ![]() | ![]() | ![]() | ![]() | ![]() |
体重![]() | ![]() | ![]() | ![]() | ![]() | ![]() | ![]() | ![]() | ![]() |
![](https://staticzujuan.xkw.com/quesimg/Upload/formula/d94592f29510fc68db32e131aab4f491.png)
![](https://staticzujuan.xkw.com/quesimg/Upload/formula/21cfa843d7ced30a0167218c66bba828.png)
更新时间:2021-06-22 09:42:15
|
【知识点】 相关指数的计算及分析解读
相似题推荐
填空题-单空题
|
容易
(0.94)
名校
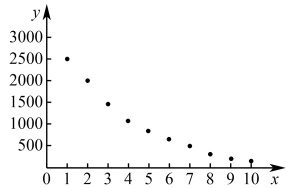
【推荐1】变量x与y的成对样本数据的散点图如图所示,若用
拟合成对数据,其决定系数记为
;若用
拟合成对数据,其决定系数记为
.则
与
大小关系为______ .(由大到小)
![](https://staticzujuan.xkw.com/quesimg/Upload/formula/240f380a560d779bb1b98804c4f06848.png)
![](https://staticzujuan.xkw.com/quesimg/Upload/formula/83459e19b5f21de4d7ca62a46ff6e5b5.png)
![](https://staticzujuan.xkw.com/quesimg/Upload/formula/ae048beafc460d7a3175258ff59edc5b.png)
![](https://staticzujuan.xkw.com/quesimg/Upload/formula/d69d4d1a7206657baa50c9a6eedb0bb1.png)
![](https://staticzujuan.xkw.com/quesimg/Upload/formula/83459e19b5f21de4d7ca62a46ff6e5b5.png)
![](https://staticzujuan.xkw.com/quesimg/Upload/formula/d69d4d1a7206657baa50c9a6eedb0bb1.png)
![](https://img.xkw.com/dksih/QBM/editorImg/2022/9/13/d9d11a3b-8729-4c78-b7eb-48dec96554f4.png?resizew=289)
您最近一年使用:0次
填空题-单空题
|
容易
(0.94)
【推荐2】在用线性回归模型研究甲、乙、丙、丁4组不同数据线性相关性的过程中,计算得到甲、乙、丙、丁4组数据对应的
的值分别为0.6,0.8,0.73,0.91,其中__________ (填甲、乙、丙、丁中的一个)组数据的线性回归效果最好.
![](https://staticzujuan.xkw.com/quesimg/Upload/formula/4c85067c53e936ef32da818efe04bdbb.png)
您最近一年使用:0次