某零售公司从1月至6月的销售量与利润的统计数据如下:
(1)根据2月至5月4个月的统计数据,求出 关于
关于 的回归直线方程
 .(
.( 的结果用分数表示);
(2)若由回归直线方程得到的估计数据与实际数据的误差均不超过1万元,则认为得到的回归直线方程是有效的.试用1月和6月的数据估计所得的回归直线方程是否有效?
参考公式: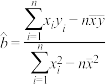 ,
, .
.
参考数据: ,
, .
.
月份 | 1 | 2 | 3 | 4 | 5 | 6 |
销售量 | 6 | 8 | 12 | 13 | 11 | 10 |
利润 | 12 | 16 | 26 | 29 | 25 | 22 |
关于的回归直线方程.(的结果用分数表示);(2)若由回归直线方程得到的估计数据与实际数据的误差均不超过1万元,则认为得到的回归直线方程是有效的.试用1月和6月的数据估计所得的回归直线方程是否有效?
参考公式:
,.参考数据:
,.
更新时间:2019-02-04 11:28:50
|
相似题推荐
解答题-应用题
|
容易
(0.94)
名校
【推荐1】某种产品的广告费用支出(万元)与销售额(万元)之间有如下的对应数据:
(1)作出销售额关于广告费用支出的散点图;
(2)求出关于的线性回归方程;
(3)据此估计估计广告费用为10万元时,销售收入的值.
参考公式: ,
, .
.
(万元)与销售额(万元)之间有如下的对应数据:
| 2 | 4 | 5 | 6 | 8 |
| 30 | 40 | 60 | 50 | 70 |
关于广告费用支出的散点图;(2)求出
关于的线性回归方程; (3)据此估计估计广告费用为10万元时,销售收入的值.
参考公式:
,.
您最近一年使用:0次
解答题-作图题
|
容易
(0.94)
名校
【推荐2】某车间为了规定工时定额,需要确定加工零件所花费的时间,为此作了四次试验,得到的数据如表:
参考公式: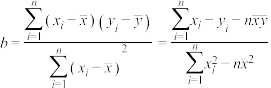 ,
, ,残差
,残差
(1)在给定的坐标系中画出表中数据的散点图;
(2)求出关于的线性回归方程 ;
;
(3)求第二个点的残差值,并预测加工10个零件需要多少小时?
零件的个数x(个) | 2 | 3 | 4 | 5 |
加工的时间y(小时) | 2.5 | 3 | 4 | 4.5 |
参考公式:
,,残差(1)在给定的坐标系中画出表中数据的散点图;
(2)求出
关于的线性回归方程;(3)求第二个点的残差值,并预测加工10个零件需要多少小时?
您最近一年使用:0次
 ,并已计算出
 ,
, ,
, ,
, .试求:
.试求:

