研究机构对某校学生往返校时间的统计资料表明:该校学生居住地到学校的距离 (单位:千米)和学生花费在上学路上的时间
 (单位:分钟)有如下的统计资料:
如果统计资料表明与有线性相关关系,试求:
(1)判断与是否有很强的线性相关性?
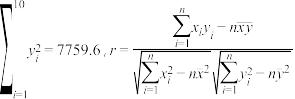
(相关系数 的绝对值大于0.75时,认为两个变量有很强的线性相关性,精确到0.01)
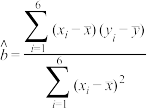
(2)求线性回归方程 (精确到0.01);
参考数据: ,
,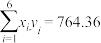 ,
,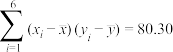 ,
,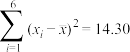 ,
,
 ,
,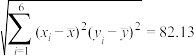
参考公式: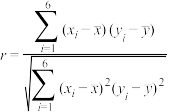 ,
,
(单位:千米)和学生花费在上学路上的时间(单位:分钟)有如下的统计资料:| 到学校的距离(千米) | 1.8 | 2.6 | 3.1 | 4.3 | 5.5 | 6.1 |
| 花费的时间(分钟) | 17.8 | 19.6 | 27.5 | 31.3 | 36.0 | 43.2 |
与有线性相关关系,试求:(1)判断
与是否有很强的线性相关性?(相关系数
的绝对值大于0.75时,认为两个变量有很强的线性相关性,精确到0.01)(2)求线性回归方程
(精确到0.01);参考数据:
,,,,,参考公式:
,
21-22高二下·江西南昌·期中 查看更多[3]
江西省南昌市八一中学2021-2022学年高二下学期期中线上测试数学(文)试题(已下线)专题14 线性回归直线与非线性回归直线方程-2021-2022学年高二数学下学期期末必考题型归纳及过关测试(人教A版2019)甘肃省白银市会宁县会宁县第三中学2022-2023学年高二下学期期末数学试题
更新时间:2022-05-11 18:10:39
|
相似题推荐
解答题-问答题
|
较易
(0.85)
名校
解题方法
【推荐1】某沙漠地区经过治理,生态系统得到很大改善,野生动物数量有所增加.某研究小组为调查该地区某种野生动物的数量,将其分成面积相近的200个地块,从这些地块中用简单随机抽样的方法抽取20个作为样区,调查得到样本数据 ,其中
,其中 和
和 分别表示第i个样区的植物覆盖面积(单位:公顷)和这种野生动物的数量,计算得
 ,
, ,
, ,
, .作散点图发现,除了明显偏离比较大的两个样本点
 ,
, 外,其它样本点大致分布在一条直线附近,为了减少误差,该研究小组剔除了这两个样本点,重新抽样补充了两个偏离比较小的样本点
 ,
, .
.
(1)求该地区这种野生动物数量的估计值(这种野生动物数量的估计值等于样区这种野生动物数量的平均数乘以地块数);
(2)建立地块的植物覆盖面积x(单位:公顷)和这种野生动物的数量y的线性回归方程;
(3)经过进一步治理,如果每个地块的植物覆盖面积增加1公顷,预测该地区这种野生动物增加的数量.
参考公式:线性回归方程 ,其中
,其中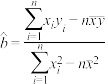 ,
, .
.
,其中和分别表示第i个样区的植物覆盖面积(单位:公顷)和这种野生动物的数量,计算得,,,.作散点图发现,除了明显偏离比较大的两个样本点,外,其它样本点大致分布在一条直线附近,为了减少误差,该研究小组剔除了这两个样本点,重新抽样补充了两个偏离比较小的样本点,.(1)求该地区这种野生动物数量的估计值(这种野生动物数量的估计值等于样区这种野生动物数量的平均数乘以地块数);
(2)建立地块的植物覆盖面积x(单位:公顷)和这种野生动物的数量y的线性回归方程;
(3)经过进一步治理,如果每个地块的植物覆盖面积增加1公顷,预测该地区这种野生动物增加的数量.
参考公式:线性回归方程
,其中,.
您最近一年使用:0次
解答题-问答题
|
较易
(0.85)
名校
解题方法
【推荐2】某研究性学习小组对春季昼夜温差大小与某花卉种子发芽多少之间的关系进行研究,他们分别记录了3月11日至3月15日的每天昼夜温差与实验室每天每100颗种子浸泡后的发芽数,得到如下资料:
(1)从3月11日至3月15日中任选2天,记这两天发芽的种子数分别为a,b,求事件A: 的概率;
的概率;
(2)研究发现种子的发芽数与昼夜温差近似成线性关系,请你求出y关于x的线性回归方程.
附:回归方程 中,
中,  ,
, ,
,
| 日期 | 3月11日 | 3月12日 | 3月13日 | 3月14日 | 3月15日 |
| 温差x(℃) | 10 | 11 | 13 | 12 | 9 |
| 发芽数y(颗) | 23 | 25 | 30 | 26 | 16 |
的概率;(2)研究发现种子的发芽数与昼夜温差近似成线性关系,请你求出y关于x的线性回归方程.
附:回归方程
中, ,,
您最近一年使用:0次
 、
、 、
、 、
、 、
、 的教师和学生的测评成绩(单位:分):
 表示选出的2所学校中学生的测评成绩大于90分的学校数,求随机变量
 .
. ,
, .
.
解答题-问答题
|
较易
(0.85)
【推荐1】科研人员在对人体脂肪含量和年龄之间关系的研究中,获得了一些年龄和脂肪含量的样本数据,如表:
根据上表的数据得到如下的散点图.
(参考数据及公式: ,
, ,
, ,
, )
)
| x(年龄/岁) | 26 | 27 | 39 | 41 | 49 | 53 | 56 | 58 | 60 | 61 |
| y(脂肪含量/%) | 14.5 | 17.8 | 21.2 | 25.9 | 26.3 | 29.6 | 31.4 | 33.5 | 35.2 | 34.6 |

(参考数据及公式:
,,,)
您最近一年使用:0次
解答题-应用题
|
较易
(0.85)
名校
解题方法
【推荐2】热心网友们调查统计了柳州市某网红景点在2022年6月至10月的旅游收入y(单位:万元),得到以下数据:
(1)根据表中所给数据,用相关系数r加以判断,是否可用线性回归模型拟合y与x的关系?若可以,求出y关于x之间的线性回归方程;若不可以,请说明理由;
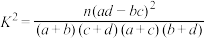
(2)为调查游客对该景点的评价情况,网友们随机抽查了200名游客,得到如图列联表,请填写2×2列联表,并判断能否有99.9%的把握认为“游客是否喜欢该网红景点与性别有关联”?
参考数据: ,
,
注:r与 的计算结果精确到0.001.参考公式:相关系数
 ,
,
线性回归方程:,其中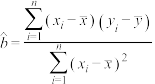 ,
, ,
,
 .
.
临界值表:
月份x | 6 | 7 | 8 | 9 | 10 |
旅游收入y | 10 | 12 | 11 | 12 | 20 |
(2)为调查游客对该景点的评价情况,网友们随机抽查了200名游客,得到如图列联表,请填写2×2列联表,并判断能否有99.9%的把握认为“游客是否喜欢该网红景点与性别有关联”?
喜欢 | 不喜欢 | 总计 | |
男 | 100 | ||
女 | 60 | ||
总计 | 110 |
,注:r与
的计算结果精确到0.001.参考公式:相关系数,线性回归方程:
,其中,,.临界值表:
| 0.010 | 0.005 | 0.001 |
| 6.635 | 7.879 | 10.828 |


您最近一年使用:0次
 .
.


