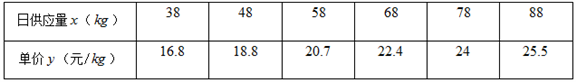
在冬季,由于受到低温和霜冻的影响,蔬菜的价格会随着需求量的增加而提升.已知某供应商向饭店定期供应某种蔬菜,其价格会随着日需求量的增加而上升,具体情形统计如下表所示:
(1)根据上表中的数据进行判断, 与
与 哪一个更适合作为日供应量
 与单价
与单价 之间的回归方程;(给出判断即可,不必说明理由);
(2)根据(1)的判断结果以及参考数据,建立关于的回归方程;
(3)该地区有 个酒店,其中
 个酒店每日对蔬菜的需求量在
 以下,
以下, 个酒店对蔬菜的需求量在以上,从这个酒店中任取个进行调查,求恰有
 个酒店对蔬菜需求量在以上的概率.
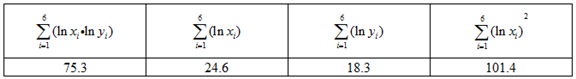
参考公式及数据:
对于一组数据 ,
, ...
... ,其回归直线
 的斜率和截距的最小二乘估计分别为
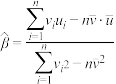 ,
,
其中: ,
, 
(1)根据上表中的数据进行判断,
与哪一个更适合作为日供应量与单价之间的回归方程;(给出判断即可,不必说明理由);(2)根据(1)的判断结果以及参考数据,建立
关于的回归方程;(3)该地区有
个酒店,其中个酒店每日对蔬菜的需求量在以下,个酒店对蔬菜的需求量在以上,从这个酒店中任取个进行调查,求恰有个酒店对蔬菜需求量在以上的概率.参考公式及数据:
对于一组数据
,...,其回归直线的斜率和截距的最小二乘估计分别为,其中:
,
更新时间:2018-05-21 09:37:00
|
相似题推荐
解答题-问答题
|
适中
(0.65)
名校
【推荐1】为研究家庭收入和食品支出的关系,随机抽取了个家庭的样本,得到数据如下表所示.
10个家庭的月收入额与食品支出额数据(单位:百元)
参考数据: ,
, ,
, ,
, ,
, .
.
参考公式:回归方程 中斜率和截距的最小二乘估计公式分别为
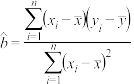 ,
, .
.
(1)恩格尔系数是食品支出总额占个人消费支出总额的比重.一个家庭或个人收入越少,用于购买生存性的食物的支出在家庭或个人收入中所占的比重就越大对一个国家而言,一个国家越穷,每个国民的平均支出中用来购买食物的费用所占比例就越大.恩格尔系数达59%以上为贫困,50~59%为温饱,40~50%为小康,30~40%为富裕,低于30%为最富裕.根据上述样本数据,请估计这个国家达到最富裕(恩格尔系数 30%)的家庭比例;
(2)建立(支出)关于(收入)的回归方程(系数精确到0.01),并解释 及
及 的现实生活意义.
10个家庭的月收入额与食品支出额数据(单位:百元)
| 家庭 | 1 | 2 | 3 | 4 | 5 | 6 | 7 | 8 | 9 | 10 |
| 收入() | 20 | 30 | 33 | 40 | 15 | 13 | 26 | 38 | 35 | 43 |
| 支出() | 7 | 9 | 8 | 11 | 5 | 4 | 8 | 10 | 9 | 10 |
,,,,.参考公式:回归方程
中斜率和截距的最小二乘估计公式分别为,.(1)恩格尔系数是食品支出总额占个人消费支出总额的比重.一个家庭或个人收入越少,用于购买生存性的食物的支出在家庭或个人收入中所占的比重就越大对一个国家而言,一个国家越穷,每个国民的平均支出中用来购买食物的费用所占比例就越大.恩格尔系数达59%以上为贫困,50~59%为温饱,40~50%为小康,30~40%为富裕,低于30%为最富裕.根据上述样本数据,请估计这个国家达到最富裕(恩格尔系数
30%)的家庭比例;(2)建立
(支出)关于(收入)的回归方程(系数精确到0.01),并解释及的现实生活意义.
您最近一年使用:0次
解答题-问答题
|
适中
(0.65)
名校
解题方法
【推荐2】从2015-2022年某地区区域发展总指数与年份的关系如下图所示.
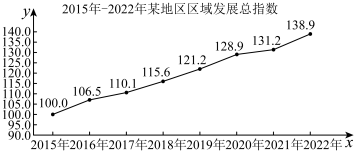
若年份(2015年记为 年记为
年记为 ,以此类推)与发展总指数存在线性关系.
(1)求年份与发展总指数的经验回归方程;
(2)根据(1)中的经验回归方程计算的各年发展总指数值(预测值)与实际发展总指数值(观测值)差的绝对值,并记为 ,称为和谐度.若
 ,则称该年为和谐发展年.经计算得2019、2020、2021这三年的和谐度分别为0.575、1.675、1.475.
①请计算2022年的和谐度;
②若从2019~2022这四年中任选两年,记事件 :两年中至少有一年为和谐发展年,求事件发生的概率
 .
.
参考公式:回归方程,其中 ,
,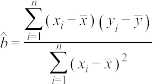 ,
,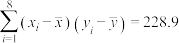 ,
,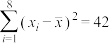 ,
, .
.
若年份
(2015年记为年记为,以此类推)与发展总指数存在线性关系.(1)求年份
与发展总指数的经验回归方程;(2)根据(1)中的经验回归方程计算的各年发展总指数值(预测值)与实际发展总指数值(观测值)差的绝对值,并记为
,称为和谐度.若,则称该年为和谐发展年.经计算得2019、2020、2021这三年的和谐度分别为0.575、1.675、1.475.①请计算2022年的和谐度;
②若从2019~2022这四年中任选两年,记事件
:两年中至少有一年为和谐发展年,求事件发生的概率.参考公式:回归方程
,其中,,,,.
您最近一年使用:0次
 (单位:万元)对年利润
 (单位:万元)的影响,对近4年的年广告费
 和年利润
和年利润 数据作了初步整理,得到下面的表格:
 ,
, ,…,
,…, ,其回归直线
 的斜率和截距的最小二乘估计分别为:
 ,
, .
.
解答题-问答题
|
适中
(0.65)
名校
解题方法
【推荐1】某校从高三年级学生中随机抽取 名学生的某次数学考试成绩,将其成绩分成
 ,
, ,
, ,
, ,
, 的组,制成如图所示的频率分布直方图.
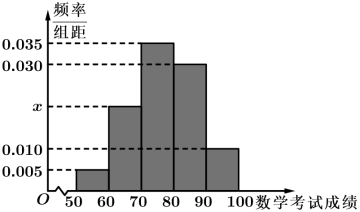
(1)求图中的值;
(2)估计这组数据的平均数;
(3)若成绩在内的学生中男生占 .现从成绩在内的学生中随机抽取人进行分析,求人中恰有名女生的概率.
名学生的某次数学考试成绩,将其成绩分成,,,,的组,制成如图所示的频率分布直方图. (1)求图中
的值;(2)估计这组数据的平均数;
(3)若成绩在
内的学生中男生占.现从成绩在内的学生中随机抽取人进行分析,求人中恰有名女生的概率.
您最近一年使用:0次
解答题-应用题
|
适中
(0.65)
解题方法
【推荐2】已知某公司成本为元,所得的利润元的几组数据入下.
根据上表数据求得回归直线方程为:
(1)若这个公司所规划的利润为200万元,估算一下它的成本可能是多少?(保留1位小数)
(2)在每一组数据中,,相差,记为事件;,相差,记为事件 ;,相差
;,相差 ,记为事件
,记为事件 .随机抽两组进行分析,则抽到有事件发生的概率.
元,所得的利润元的几组数据入下.| 第一组 | 第二组 | 第三组 | 第四组 | 第五组 | |
| 1 | 4 | 5 | 2 | 3 |
| 2 | 1 | 3 | 4 | 0 |
根据上表数据求得回归直线方程为:
(1)若这个公司所规划的利润为200万元,估算一下它的成本可能是多少?(保留1位小数)
(2)在每一组数据中,
,相差,记为事件;,相差,记为事件;,相差,记为事件.随机抽两组进行分析,则抽到有事件发生的概率.
您最近一年使用:0次
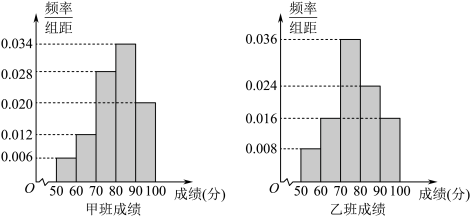
 列联表,并判断是否有
 的把握认为“成绩优秀”与所在教学班级有关?
 的所有学生中任选2人,记事件
 .
.  ,其中
,其中 .
.


