1 . 已知函数 的部分图象如图所示.
 的解析式;
的解析式;
(2)求的对称轴方程;
(3)求的单调递增区间;
(4)函数 的图象经过怎样的变换能得到函数的图象.
的部分图象如图所示.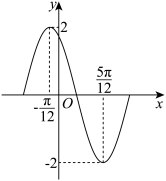
的解析式;(2)求
的对称轴方程;(3)求
的单调递增区间;(4)函数
的图象经过怎样的变换能得到函数的图象.
您最近一年使用:0次
2 . 如图,某地一天从 时至
时至 时的温度变化曲线近似满足函数
 ,其中
,其中 ,且函数在
,且函数在 与
与 时分别取得最小值和最大值. 这段时间的最大温差为
___ ; 的一个取值为
___________ .

时至时的温度变化曲线近似满足函数,其中,且函数在与时分别取得最小值和最大值. 这段时间的最大温差为的一个取值为
您最近一年使用:0次


