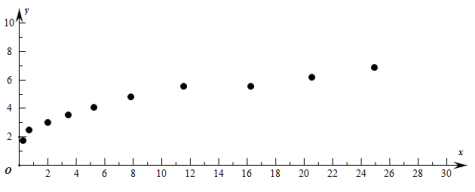
从集市上买回来的蔬菜仍存有残留农药,食用时需要清洗数次,统计表中的 表示清洗的次数,
 表示清洗次后
 千克该蔬菜残留的农药量(单位:微克).
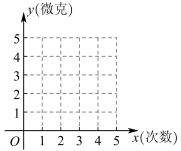
(1)在如图的坐标系中,描出散点图,并根据散点图判断, 与
与 哪一个适宜作为清洗次后千克该蔬菜残留的农药量的回归方程类型;(给出判断即可,不必说明理由)
(2)根据判断及下面表格中的数据,建立关于的回归方程;
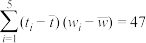
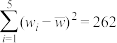
表中 ,
, .
.
(3)对所求的回归方程进行残差分析.
附:①线性回归方程中系数计算公式分别为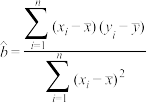 ,
, ;
;
②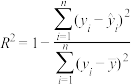 ,
, 说明模拟效果非常好;
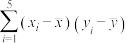
③ ,
, ,
, ,
, ,
, .
.
表示清洗的次数,表示清洗次后千克该蔬菜残留的农药量(单位:微克).x | 1 | 2 | 3 | 4 | 5 |
y | 4.5 | 2.2 | 1.4 | 1.3 | 0.6 |
与哪一个适宜作为清洗次后千克该蔬菜残留的农药量的回归方程类型;(给出判断即可,不必说明理由)(2)根据判断及下面表格中的数据,建立
关于的回归方程;表中
,. |  |  |  |  |  |  |
| 3 | 2 | 0.12 | 10 | 0.09 | -8.7 | 0.9 |
(3)对所求的回归方程进行残差分析.
附:①线性回归方程
中系数计算公式分别为,;②
,说明模拟效果非常好;③
,,,,.
17-18高三·重庆·阶段练习 查看更多[4]
【全国百强校】重庆市第八中学2018届高考适应性月考(六)数学(文)试题重庆市凤鸣山中学2020届高三下学期6月月考数学(文)试题(已下线)专题10-1 统计大题:线性和非线性回归与残差-2022年高考数学毕业班二轮热点题型归纳与变式演练(全国通用)河北省石家庄市辛集市育才中学2022-2023学年高二下学期6月月考数学试题
更新时间:2020-06-25 12:32:46
|
相似题推荐
解答题-应用题
|
适中
(0.65)
解题方法
【推荐1】某饮料店为了解一天的平均气温与奶茶销量之间的关系,记录了周一至周五的平均气温(℃)与奶茶销量(杯),得到如下数据:
(1)请画出上表数据的散点图;
(2)请根据上表提供的数据,用最小二乘法求出关于的线性回归方程;
(3)试根据(1)求出的线性回归方程,预测平均气温均为20℃时该奶茶店的这种饮料销量.
( ,
, )
)
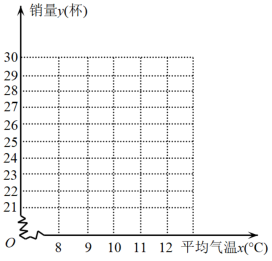
(℃)与奶茶销量(杯),得到如下数据:| 平均气温(℃) | 9 | 11 | 12 | 10 | 8 |
| 销量(杯) | 23 | 26 | 30 | 25 | 21 |
(2)请根据上表提供的数据,用最小二乘法求出
关于的线性回归方程;(3)试根据(1)求出的线性回归方程,预测平均气温均为20℃时该奶茶店的这种饮料销量.
(
,)
您最近一年使用:0次
解答题-作图题
|
适中
(0.65)
解题方法
【推荐2】某班5名学生的数学和物理成绩(单位:分)如下表:
(1)画出散点图:
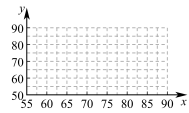
(2)求物理成绩对数学成绩的回归直线方程:( ,
, 保留三位小数)
(3)一名学生的数学成绩是96分,试预测他的物理成绩.(保留整数)
附: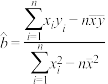 ,
,
(参考数据: ,
, )
)
| A | B | C | D | E | |
数学成绩 | 88 | 76 | 73 | 66 | 63 |
物理成绩 | 78 | 65 | 71 | 64 | 61 |
(1)画出散点图:
(2)求物理成绩
对数学成绩的回归直线方程:(,保留三位小数)(3)一名学生的数学成绩是96分,试预测他的物理成绩.(保留整数)
附:
,(参考数据:
,)
您最近一年使用:0次
 的回归系数a,b;
解答题-应用题
|
适中
(0.65)
名校
解题方法
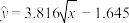
【推荐1】当前,全球贸易格局发生重大变化,随着中美贸易战的不断升级,让越来越多的中国科技企业开始意识到自主创新的重要性,大大加强科技研发投入的力度,形成掌控高新尖端核心技术及其市场的能力.某企业为确定下一年对某产品进行科技升级的研发费用,需了解该产品年研发费用(单位:千万元)对年销售量(单位:千万件)和年利润 (单位:千万元)的影响.根据市场调研与模拟,对收集的数据
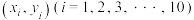 进行初步处理,得到散点图及一些统计量的值如下:
表中 ,
, .
.
(1)根据散点图判断, 与
与 哪一个更适合作为年销售量关于年研发费用的回归方程类型(给出判断即可,不必说明理由),并根据判断结果及表中数据,建立关于的回归方程;
附:对于一组数据 ,其回归直线
 的斜率和截距的最小二乘估计分别为
 ,
, .
.
(2)已知年利润与,的关系为 (其中
(其中 为自然对数的底数),要使企业下一年的年利润最大,预计下一年应投入多少研发费用?
(3)科技升级后,该产品的效率 大幅提高,经试验统计得大致服从正态分布
 .企业对科技升级团队的奖励方案如下:若不超过
 ,不予奖励;若超过,但不超过
 ,每件产品奖励2元;若超过,每件产品奖励4元.记
 为每件产品获得的奖励,求
 (精确到0.01).
附:若随机变量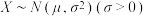 ,则
,则 ,
, .
.
(单位:千万元)对年销售量(单位:千万件)和年利润(单位:千万元)的影响.根据市场调研与模拟,对收集的数据进行初步处理,得到散点图及一些统计量的值如下:
|
|
|
|
30.5 | 15 | 15 | 46.5 |


表中
,.(1)根据散点图判断,
与哪一个更适合作为年销售量关于年研发费用的回归方程类型(给出判断即可,不必说明理由),并根据判断结果及表中数据,建立关于的回归方程;附:对于一组数据
,其回归直线的斜率和截距的最小二乘估计分别为,.(2)已知年利润
与,的关系为(其中为自然对数的底数),要使企业下一年的年利润最大,预计下一年应投入多少研发费用?(3)科技升级后,该产品的效率
大幅提高,经试验统计得大致服从正态分布.企业对科技升级团队的奖励方案如下:若不超过,不予奖励;若超过,但不超过,每件产品奖励2元;若超过,每件产品奖励4元.记为每件产品获得的奖励,求(精确到0.01).附:若随机变量
,则,.
您最近一年使用:0次
解答题-应用题
|
适中
(0.65)
【推荐2】某公司生产一种产品,从流水线上随机抽取100件产品,统计其质量指数并绘制频率分布直方图(如图1):
产品的质量指数在 的为三等品,在
 的为二等品,在
 的为一等品,该产品的三、二、一等品的销售利润分别为每件1.5,3.5,5.5(单位:元),以这100件产品的质量指数位于各区间的频率代替产品的质量指数位于该区间的概率.
(1)求每件产品的平均销售利润;
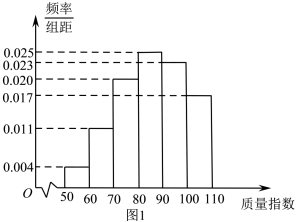
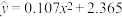
(2)该公司为了解年营销费用(单位:万元)对年销售量(单位:万件)的影响,对近5年的年营销费用 和年销售量
和年销售量
 数据做了初步处理,得到的散点图(如图2)及一些统计量的值.
表中,, ,
,
根据散点图判断, 可以作为年销售量(万件)关于年营销费用(万元)的回归方程.
(ⅰ)建立关于的回归方程;
(ⅱ)用所求的回归方程估计该公司应投入多少营销费,才能使得该产品一年的收益达到最大?(收益=销售利润-营销费用,取 )
)
参考公式:对于一组数据: ,
, ,
, ,
, ,其回归直线
 的斜率和截距的最小乘估计分别为
 ,
,
产品的质量指数在
的为三等品,在的为二等品,在的为一等品,该产品的三、二、一等品的销售利润分别为每件1.5,3.5,5.5(单位:元),以这100件产品的质量指数位于各区间的频率代替产品的质量指数位于该区间的概率.(1)求每件产品的平均销售利润;
(2)该公司为了解年营销费用
(单位:万元)对年销售量(单位:万件)的影响,对近5年的年营销费用和年销售量数据做了初步处理,得到的散点图(如图2)及一些统计量的值. |  | 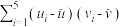 |  |
| 16.30 | 24.87 | 0.41 | 1.64 |
表中
,,,根据散点图判断,
可以作为年销售量(万件)关于年营销费用(万元)的回归方程.(ⅰ)建立
关于的回归方程;(ⅱ)用所求的回归方程估计该公司应投入多少营销费,才能使得该产品一年的收益达到最大?(收益=销售利润-营销费用,取
)参考公式:对于一组数据:
,,,,其回归直线的斜率和截距的最小乘估计分别为,
您最近一年使用:0次
 )对该微生物的活性指标


 还是
还是 ,并求
,并求 ,则环境温度应不得高于多少
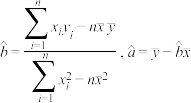 .
.
解答题-应用题
|
适中
(0.65)
名校
解题方法
【推荐1】近年来,我国新能源汽车发展进入新阶段.某品牌 年到
年到 年新能源汽车年销量
 (万)如下表:其中年对应的年份代码
 为
为 .
.
(1)判断两个变量是否线性相关,并计算样本相关系数(精确到 );
);
(2)(i)假设变量与变量的 对观测数据为
 ,两个变量满足一元线性回归模型
 (随机误差
(随机误差 ),请写出参数
 的最小二乘估计;
(ii)令变量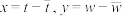 ,则变量与变量满足一元线性回归模型,利用(i)中结论求关于的经验回归方程,并预测
 年该品牌新能源汽车的销售量.
附:样本相关系数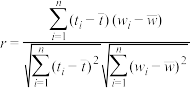 ,
, ,
, ,
, ,
,
年到年新能源汽车年销量(万)如下表:其中年对应的年份代码为.年份代码 | 1 | 2 | 3 | 4 | 5 |
销量 | 4 | 9 | 14 | 18 | 25 |
);(2)(i)假设变量
与变量的对观测数据为,两个变量满足一元线性回归模型(随机误差),请写出参数的最小二乘估计;(ii)令变量
,则变量与变量满足一元线性回归模型,利用(i)中结论求关于的经验回归方程,并预测年该品牌新能源汽车的销售量.附:样本相关系数
,,,,
您最近一年使用:0次
解答题-问答题
|
适中
(0.65)
解题方法
【推荐2】已知x,y之间的一组数据如表:
(1)分别从集合A={1,3,6,7,8},B={1,2,3,4,5}中各取一个数x,y,求 的概率;
的概率;
(2)对于表中数据,甲、乙两同学给出的拟合直线分别为 与
与 ,试根据残差平方和:
 的大小,判断哪条直线拟合程度更好.
| x | 1 | 3 | 6 | 7 | 8 |
| y | 1 | 2 | 3 | 4 | 5 |
的概率;(2)对于表中数据,甲、乙两同学给出的拟合直线分别为
与,试根据残差平方和:的大小,判断哪条直线拟合程度更好.
您最近一年使用:0次
解答题-问答题
|
适中
(0.65)
名校
【推荐3】中国共产党第二十次全国代表大会上的报告中提到,新时代十年我国经济实力实现历史性跃升,国内生产总值从54万亿元增长到114万亿元,我国经济总量稳居世界第二位.建立年份编号为解释变量,地区生产总值为响应变量的一元线性回归模型,现就2012-2016某市的地区生产总值统计如下:
(1)求出回归方程,并计算2016年地区生产总值的残差;
(2)随着我国打赢了人类历史上规模最大的脱贫攻坚战,该市2017-2022的地区生产总值持续增长,现对这11年的数据有三种经验回归模型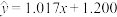 、
、 、
、 ,它们的
,它们的 分别为0.976、0.880和0.985,请根据的数值选择最好的回归模型预测一下2023年该市的地区生产总值;
(3)若2012-2022该市的人口数(单位:百万)与年份编号的回归模型为 ,结合(2)问中的最佳模型,预测一下在2023年以后,该市人均地区生产总值的变化趋势.
参考公式: ,;
,;
年份 | 2012 | 2013 | 2014 | 2015 | 2016 |
年份编号 | 1 | 2 | 3 | 4 | 5 |
地区生产总值(亿元) | 2.8 | 3.1 | 3.9 | 4.6 | 5.6 |
(2)随着我国打赢了人类历史上规模最大的脱贫攻坚战,该市2017-2022的地区生产总值持续增长,现对这11年的数据有三种经验回归模型
、、,它们的分别为0.976、0.880和0.985,请根据的数值选择最好的回归模型预测一下2023年该市的地区生产总值;(3)若2012-2022该市的人口数(单位:百万)与年份编号的回归模型为
,结合(2)问中的最佳模型,预测一下在2023年以后,该市人均地区生产总值的变化趋势.参考公式:
,;
您最近一年使用:0次


