一台还可以用的机器由于使用的时间较长,它按不同的转速生产出来的某机械零件有一些会有缺陷,每小时生产有缺陷零件的多少随机器运转的速率而变化,下表为抽样试验结果:
通过观察散点图,发现 与
与 有线性相关关系:
(1)求关于的回归直线方程;
(参考:回归直线方程为 ,其中
,其中 ,
, )
)
(2)若实际生产中,允许每小时生产的产品中有缺陷的零件最多为 个,那么机器的运转速度应控制在什么范围内?
转速 |
|
|
|
|
每小时生产有缺陷的零件数 |
|
|
|
|


 与有线性相关关系:
(1)求
关于的回归直线方程;(参考:回归直线方程为
,其中,)(2)若实际生产中,允许每小时生产的产品中有缺陷的零件最多为
个,那么机器的运转速度应控制在什么范围内?
更新时间:2021-08-17 13:20:17
|
相似题推荐
解答题-问答题
|
较易
(0.85)
名校
【推荐1】随着中美贸易战的不断升级,越来越多的国内科技巨头加大了科技研发投入的力度.华为技术有限公司拟对“麒麟”手机芯片进行科技升级,根据市场调研与模拟,得到科技升级投入x(亿元)与科技升级直接收益y(亿元)的数据统计如下:
当 时,建立了y与x的两个回归模型:模型①:
 ;模型②:
;模型②: ;当
;当 时,确定y与x满足的线性回归方程为
 .
.
(1)根据下列表格中的数据,比较当时模型①、②的相关指数 的大小,并选择拟合精度更高、更可靠的模型,预测对“麒麟”手机芯片科技升级的投入为17亿元时的直接收益.
(附:刻画回归效果的相关指数,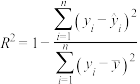 ,
, )
)
(2)为鼓励科技创新,当科技升级的投入不少于20亿元时,国家给予公司补贴5亿元,以回归方程为预测依据,比较科技升级投入17亿元与20亿元时公司实际收益的大小.
附:用最小二乘法求线性回归方程的系数: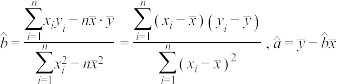
序号 | 1 | 2 | 3 | 4 | 5 | 6 | 7 | 8 | 9 | 10 | 11 | 12 |
x | 2 | 3 | 4 | 6 | 8 | 10 | 13 | 21 | 22 | 23 | 24 | 25 |
y | 13 | 22 | 31 | 42 | 50 | 56 | 58 | 68.5 | 68 | 67.5 | 66 | 66 |
时,建立了y与x的两个回归模型:模型①:;模型②:;当时,确定y与x满足的线性回归方程为.(1)根据下列表格中的数据,比较当
时模型①、②的相关指数的大小,并选择拟合精度更高、更可靠的模型,预测对“麒麟”手机芯片科技升级的投入为17亿元时的直接收益.回归模型 | 模型① | 模型② |
回归方程 |
|
|
| 182.4 | 79.2 |
 ,)
,)(2)为鼓励科技创新,当科技升级的投入不少于20亿元时,国家给予公司补贴5亿元,以回归方程为预测依据,比较科技升级投入17亿元与20亿元时公司实际收益的大小.
附:用最小二乘法求线性回归方程
的系数:
您最近一年使用:0次
解答题-问答题
|
较易
(0.85)
解题方法
【推荐2】某校高一2班学生每周用于数学学习的时间(单位: )与数学成绩(单位:分)之间有如下数据:
某同学每周用于数学学习的时间为18小时,试预测该生数学成绩.
(单位:)与数学成绩(单位:分)之间有如下数据: | 24 | 15 | 23 | 19 | 16 | 11 | 20 | 16 | 17 | 13 |
| 92 | 79 | 97 | 89 | 64 | 47 | 83 | 68 | 71 | 59 |
您最近一年使用:0次
解答题-应用题
|
较易
(0.85)
名校
解题方法
【推荐3】某企业坚持以市场需求为导向,合理配置生产资源,不断改革、探索销售模式.下表是该企业每月生产的一种核心产品的产量(件 与相应的生产总成本(万元)的五组对照数据:
(1)试求与的相关系数 ,并利用相关系数说明与是否具有较强的线性相关关系(若
 ,则线性相关程度很高,可用线性回归模型拟合);
(2)建立关于的回归方程,并预测:当为6时,生产总成本的估计值.
参考公式: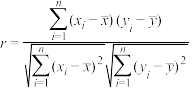 ,
, ,
, .参考数据:
 .
.
(件与相应的生产总成本(万元)的五组对照数据:| 产量(件 | 1 | 2 | 3 | 4 | 5 |
| 生产总成本(万元) | 3 | 7 | 8 | 10 | 12 |
(1)试求
与的相关系数,并利用相关系数说明与是否具有较强的线性相关关系(若,则线性相关程度很高,可用线性回归模型拟合);(2)建立
关于的回归方程,并预测:当为6时,生产总成本的估计值.参考公式:
,,.参考数据:.
您最近一年使用:0次
解答题-应用题
|
较易
(0.85)
解题方法
【推荐1】北京时间2022年4月5日,CBA官方公布了2021—2022赛季CBA季后赛1/4决赛赛程表.赛程表显示,1/4决赛将在4月7日(周四)15:00打响,首场比赛是上半区的辽宁本钢迎战山西汾酒股份.其中辽宁队当家球星郭艾伦信心满满,球迷们终于可以一饱眼福.为了更好地预测球员郭艾伦在首战中的发挥情况,球迷们收集了郭艾伦赛前的一场比赛的数据如表所示.
由上表数据可知,可用线性回归模型拟合y与x的关系.
(1)请用相关系数说明y与x具有很强的线性相关关系;(精确到0.01)
(2)求出y关于x的线性回归方程,并预测球员郭艾伦在首战中出场时间40分钟的累计得分.(回归方程的斜率与纵截距精确到0.1,累计得分保留整数)
附:相关系数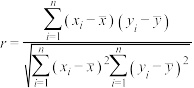
线性回归方程的斜率与截距的最小二乘法公式分别为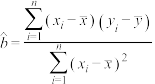 ,.
,.
参考数据: ,
, .
.
上场时间x(分钟) | 6 | 11 | 18 | 24 | 32 | 35 |
累计得分y(分) | 5 | 12 | 16 | 22 | 31 | 40 |
(1)请用相关系数说明y与x具有很强的线性相关关系;(精确到0.01)
(2)求出y关于x的线性回归方程,并预测球员郭艾伦在首战中出场时间40分钟的累计得分.(回归方程的斜率与纵截距精确到0.1,累计得分保留整数)
附:相关系数
线性回归方程
的斜率与截距的最小二乘法公式分别为,.参考数据:
,.
您最近一年使用:0次
解答题-问答题
|
较易
(0.85)
【推荐2】电容器充电后,电压达到100 V,然后开始放电,由经验知道,此后电压U随时间t变化的规律用公式U=Aebt(b<0)表示,现测得时间t(s)时的电压U(V)如下表:
t(s) | 0 | 1 | 2 | 3 | 4 | 5 | 6 | 7 | 8 | 9 | 10 |
U(V) | 100 | 75 | 55 | 40 | 30 | 20 | 15 | 10 | 10 | 5 | 5 |
试求:电压U对时间t的回归方程.(提示:对公式两边取自然对数,把问题转化为线性回归分析问题)
您最近一年使用:0次
解答题-问答题
|
较易
(0.85)
名校
解题方法
【推荐3】某沙漠地区经过治理,生态系统得到很大改善,野生动物数量有所增加.某研究小组为调查该地区某种野生动物的数量,将其分成面积相近的200个地块,从这些地块中用简单随机抽样的方法抽取20个作为样区,调查得到样本数据 ,其中
,其中 和
和 分别表示第i个样区的植物覆盖面积(单位:公顷)和这种野生动物的数量,计算得
 ,
, ,
, ,
, .作散点图发现,除了明显偏离比较大的两个样本点
 ,
, 外,其它样本点大致分布在一条直线附近,为了减少误差,该研究小组剔除了这两个样本点,重新抽样补充了两个偏离比较小的样本点
 ,
, .
.
(1)求该地区这种野生动物数量的估计值(这种野生动物数量的估计值等于样区这种野生动物数量的平均数乘以地块数);
(2)建立地块的植物覆盖面积x(单位:公顷)和这种野生动物的数量y的线性回归方程;
(3)经过进一步治理,如果每个地块的植物覆盖面积增加1公顷,预测该地区这种野生动物增加的数量.
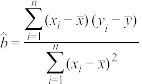
参考公式:线性回归方程 ,其中
,其中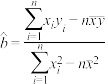 ,
, .
.
,其中和分别表示第i个样区的植物覆盖面积(单位:公顷)和这种野生动物的数量,计算得,,,.作散点图发现,除了明显偏离比较大的两个样本点,外,其它样本点大致分布在一条直线附近,为了减少误差,该研究小组剔除了这两个样本点,重新抽样补充了两个偏离比较小的样本点,.(1)求该地区这种野生动物数量的估计值(这种野生动物数量的估计值等于样区这种野生动物数量的平均数乘以地块数);
(2)建立地块的植物覆盖面积x(单位:公顷)和这种野生动物的数量y的线性回归方程;
(3)经过进一步治理,如果每个地块的植物覆盖面积增加1公顷,预测该地区这种野生动物增加的数量.
参考公式:线性回归方程
,其中,.
您最近一年使用:0次


