已知某种植物每日平均增长高度 (单位:
(单位: )与每日光照时间
 (单位:
(单位: )之间的关系有如下一组数据:
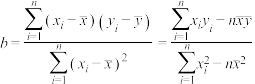
(1)求关于的回归直线方程;
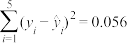
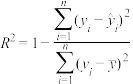
(2)计算相关指数 的值,并说明回归模型拟合程度的好坏;
(3)若某天光照时间为8.5小时, 预测该天这种植物的平均增长高度(结果精确到0.1)
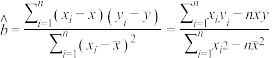
参考公式及数据: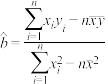 ,
, ,
, ,
,
 ,
, ,
,
(单位:)与每日光照时间(单位:)之间的关系有如下一组数据:
| 6 | 7 | 8 | 9 | 10 |
| 3.5 | 5.2 | 7 | 8.6 | 10.7 |
关于的回归直线方程;(2)计算相关指数
的值,并说明回归模型拟合程度的好坏;(3)若某天光照时间为8.5小时, 预测该天这种植物的平均增长高度(结果精确到0.1)
参考公式及数据:
,,, ,,
更新时间:2019-05-06 05:34:53
|
相似题推荐
解答题-问答题
|
较易
(0.85)
名校
解题方法
【推荐1】 五位学生的数学成绩与物理成绩(单位:分)如表:
(1)请根据上表提供的数据,用最小二乘法求出关于的回归直线方程;
(2)若学生 的数学成绩为90分,试根据(1)求出的回归方程,预测其物理成绩(结果保留整数).
(附: ,
, ,)
,)
五位学生的数学成绩与物理成绩(单位:分)如表: | 80 | 75 | 70 | 65 | 60 |
| 70 | 66 | 68 | 64 | 62 |
关于的回归直线方程;(2)若学生
的数学成绩为90分,试根据(1)求出的回归方程,预测其物理成绩(结果保留整数).(附:
,,)
您最近一年使用:0次
解答题-问答题
|
较易
(0.85)
解题方法
【推荐2】某地区某农产品的销售量与年份有关,下表是近五年的部分统计数据:
用所给数据求年销售量(吨)与年份之间的回归直线方程 ,并根据所求出的直线方程预测该地区2019年该农产品的销售量.
参考公式: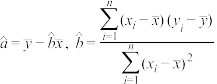 .
.
| 年份 | 2010 | 2012 | 2014 | 2016 | 2018 |
| 销售量(吨) | 114 | 115 | 116 | 116 | 114 |
(吨)与年份之间的回归直线方程,并根据所求出的直线方程预测该地区2019年该农产品的销售量.参考公式:
.
您最近一年使用:0次
解答题-问答题
|
较易
(0.85)
解题方法
【推荐1】“民族要复兴,乡村必振兴”.近年来,我国农村居民人均可支配收入逐年上升,下面给出了根据我国 年中国农村居民人均可支配收入(单位:元)和年份代码绘制的条形图和线性回归方程的残差图(
 年
年 年的年代代码分别为
 )
)
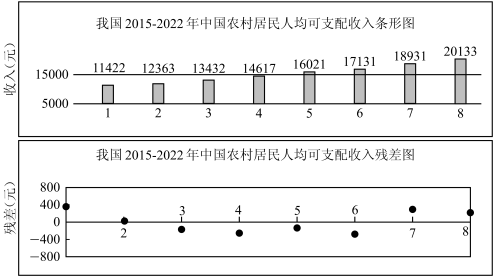
(1)根据条形图相应数据计算得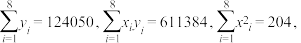 求关于的线性回归方程;
(2)根据线性回归方程的残差图,分析线性回归方程的拟合效果.(精确到 )
)
附:线性回归方程 中的回归系数和回归截距的计算公式分别为:
年中国农村居民人均可支配收入(单位:元)和年份代码绘制的条形图和线性回归方程的残差图(年年的年代代码分别为) (1)根据条形图相应数据计算得
求关于的线性回归方程;(2)根据线性回归方程的残差图,分析线性回归方程的拟合效果.(精确到
)附:线性回归方程
中的回归系数和回归截距的计算公式分别为:
您最近一年使用:0次
解答题-问答题
|
较易
(0.85)
名校
【推荐2】2018年3月30日,联合国粮农组织、联合国世界粮食计划署联合发布的《全国粮食危机报告》称全国粮食危机依然十分严峻,某地最近五年粮食需求量如表:

(1)若最近五年的粮食需求量年平均数为260万吨,且粮食年需求量与年份之间的线性回归方程为 ,求实数
,求实数 的值;
的值;
(2)利用(1)中所求出的回归方程预测该地2020年粮食需求量.
(1)若最近五年的粮食需求量年平均数为260万吨,且粮食年需求量
与年份之间的线性回归方程为,求实数的值;(2)利用(1)中所求出的回归方程预测该地2020年粮食需求量.
您最近一年使用:0次
 ,
,


