1 . 某超市为了解气温对某产品销售量的影响,随机记录了该超市12月份中 天的日销售量
 (单位:千克)与该地当日最低气温
 (单位:
(单位: )的数据,如下表所示:
 求关于的线性回归方程
 ;(精确到
;(精确到 )
)
 判断与之间是正相关还是负相关;若该地12月份某天的最低气温为
 ,请用中的回归方程预测该超市当日的销售量.
参考公式: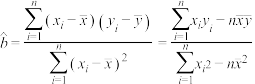 ,
,
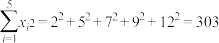
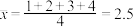
参考数据: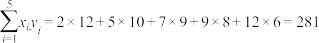 ,
,
天的日销售量(单位:千克)与该地当日最低气温(单位:)的数据,如下表所示: |  | |  |  |  |
| |  | |  |  |
求关于的线性回归方程;(精确到)判断与之间是正相关还是负相关;若该地12月份某天的最低气温为,请用中的回归方程预测该超市当日的销售量.参考公式:
,参考数据:
,
您最近一年使用:0次
2019-09-19更新
|
640次组卷
|
3卷引用:广东省潮州市2018-2019学年高二下学期期末教学质量检测数学(文)试题
广东省潮州市2018-2019学年高二下学期期末教学质量检测数学(文)试题广东省潮州市2018-2019学年高二下学期期末教学质量检测数学(理)试题(已下线)8.1.1 变量的相关关系(分层作业)-【上好课】高二数学同步备课系列(人教A版2019选择性必修第三册)
2 . 消费者信心指数是反映消费者信心强弱的指标;它是预测经济走势和消费趋向的一个先行指标,是监测经济周期变化的重要依据.消费者信心指数值介于0和200之间.指数超过100时,表明消费者信心处于强信心区;指数等于100时,表示消费者信心处于强弱临界点;指数小于100时,表示消费者信心处于弱信心区.我国某城市从2016年到2019年各季度的消费者信心指数如下表1:
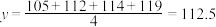
记2016年至2019年年份序号为 ,该城市各年消费者信心指数的年均值(四舍五入取整)为y,x与y的关系如下表2:
(1)该城市在2017年和2018年的四个季度的消费者信心指数中各任取一个,求2018年的消费者信心指数不小于2017年的消费者信心指数的概率;
(2)根据表2得到线性回归方程为: ,求
,求 的值,并预报该城市2020年消费者信心指数的年平均值.
(3)根据表2计算 的相关系数r(保留两位小数),并判断是否正相关很强.
参考数据和公式: ;
; ;
; ;
; ;
; ;
;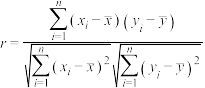 ;当
;当 时,y与x正相关很强.
| 2016年 | 2017年 | 2018年 | 2019年 | |
| 第一季度 | 104.50 | 111.70 | 118.50 | 119.30 |
| 第二季度 | 104.00 | 110.20 | 114.60 | 118.20 |
| 第三季度 | 105.50 | 114.20 | 110.20 | 118.10 |
| 第四季度 | 106.80 | 113.20 | 113.20 | 119.30 |
,该城市各年消费者信心指数的年均值(四舍五入取整)为y,x与y的关系如下表2:| 年份序号x | 1 | 2 | 3 | 4 |
| 消费者信心指数年均值y | 105 | 112 | 114 | 119 |
(2)根据表2得到线性回归方程为:
,求的值,并预报该城市2020年消费者信心指数的年平均值.(3)根据表2计算
的相关系数r(保留两位小数),并判断是否正相关很强.参考数据和公式:
;;;;;;当时,y与x正相关很强.
您最近一年使用:0次


