1 . 下表是关于某设备的使用年限(年)和所需要的维修费用y (万元)的几组统计数据:
(1)请在给出的坐标系中画出上表数据的散点图;
(2)请根据散点图,判断y与x之间是否有较强线性相关性,若有求线性回归直线方程 ;
;
(3)估计使用年限为10年时,维修费用为多少?(参考数值:
 )
)
(参考公式: ;
; ;)
;)
 | 2 | 3 | 4 | 5 | 6 |
 | 2.2 | 3.8 | 5.5 | 6.5 | 7.0 |
(1)请在给出的坐标系中画出上表数据的散点图;
(2)请根据散点图,判断y与x之间是否有较强线性相关性,若有求线性回归直线方程
;(3)估计使用年限为10年时,维修费用为多少?(参考数值:
)(参考公式:
; ;)
您最近一年使用:0次
2 . 在某次试验中,有两个试验数据 ,统计的结果如下面的表格.
(1)在给出的坐标系中画出的散点图;
(2)然后根据表格的内容和公式求出 对
对 的回归直线方程
 ,并估计当为10时的值是多少?
,统计的结果如下面的表格.(1)在给出的坐标系中画出
的散点图; | 1 | 2 | 3 | 4 | 5 |
| 2 | 3 | 4 | 4 | 5 |
(2)然后根据表格的内容和公式求出
对的回归直线方程,并估计当为10时的值是多少?
您最近一年使用:0次
3 . 一台机器使用的时间较长,但还可以使用,它按不同的转速生产出来的某机械零件有一些会有缺点,每小时生产有缺点零件的多少,随机器运转的速度而变化,下表为抽样试验的结果:
(Ⅰ)画出散点图;
(Ⅱ)如果y对x有线性相关关系,求回归直线方程;
(Ⅲ)若实际生产中,允许每小时的产品中有缺点的零件最多为10个,那么机器的运转速度应控制在什么范围内?
参考公式: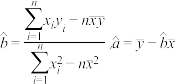
| 转速x(转/秒) | 16 | 14 | 12 | 8 |
| 每小时生产有缺点的零件数y(件) | 11 | 9 | 8 | 5 |
(Ⅰ)画出散点图;
(Ⅱ)如果y对x有线性相关关系,求回归直线方程;
(Ⅲ)若实际生产中,允许每小时的产品中有缺点的零件最多为10个,那么机器的运转速度应控制在什么范围内?
参考公式:
您最近一年使用:0次
2016-12-03更新
|
296次组卷
|
2卷引用:2014-2015学年河北省临漳一中高二下学期期中考试文科数学试卷
名校
4 . 某学校一个生物兴趣小组对学校的人工湖中养殖的某种鱼类进行观测研究,在饲料充足的前提下,兴趣小组对饲养时间x(单位:月)与这种鱼类的平均体重y(单位:千克)得到一组观测值,如下表:
(1)在给出的坐标系中,画出关于x、y两个相关变量的散点图.
(2)请根据上表提供的数据,用最小二乘法求出变量关于变量的线性回归直线方程 .
.
(3)预测饲养满12个月时,这种鱼的平均体重(单位:千克).
(参考公式: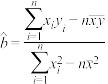 ,
, )
)
 (月) (月) |  |  |  |  |  |
 (千克) (千克) |  |  |  |  |  |
(2)请根据上表提供的数据,用最小二乘法求出变量
关于变量的线性回归直线方程.(3)预测饲养满12个月时,这种鱼的平均体重(单位:千克).
(参考公式:
,)
您最近一年使用:0次
2016-12-04更新
|
985次组卷
|
3卷引用:2015-2016学年河北省衡水二中高二上期中文科数学试卷
12-13高二上·河北石家庄·期末
5 . 一个车间为了规定工时定额,需要确定加工零件所花费的时间,为此进行了4次试验.收集的数据如下:
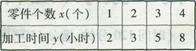
(I)请画出上表数据的散点图;
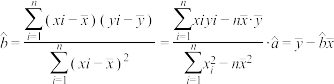
(Ⅱ)请根据上表提供的数据,用最小二乘法求出关于的线性回归方程 ;
;
(Ⅲ)现需生产20件此零件,预测需用多长时间?
(注:用最小二乘法求线性回归方程系数公式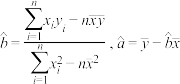 .
.
(I)请画出上表数据的散点图;
(Ⅱ)请根据上表提供的数据,用最小二乘法求出
关于的线性回归方程;(Ⅲ)现需生产20件此零件,预测需用多长时间?
(注:用最小二乘法求线性回归方程系数公式
.
您最近一年使用:0次
名校
6 . 某百货公司1~6月份的销售量与利润的统计数据如下表:
(1)根据2至5月份的数据,画出散点图求出关于的回归直线方程.
(2)若由回归直线方程得到的估计数据与剩下的检验数据的误差均不超过万元,则认为得到的回归直线方程是理想的,试问所得回归直线方程是否理想?请说明理由.
 .
.
与利润的统计数据如下表: | 月份 | | | | | |  |
| 销售量(万件) |  |  |  |  |  | |
| 利润(万元) |  |  |  |  |  | |
关于的回归直线方程.(2)若由回归直线方程得到的估计数据与剩下的检验数据的误差均不超过
万元,则认为得到的回归直线方程是理想的,试问所得回归直线方程是否理想?请说明理由..
您最近一年使用:0次
2017-03-05更新
|
1013次组卷
|
6卷引用:2016-2017学年河北省廊坊市高二上学期期末考试文数试卷
7 . 为了研究注射某种抗病毒疫苗后是否产生抗体与某项指标值的相关性,研究人员从某地区10万人中随机抽取了200人,对其注射疫苗后的该项指标值进行测量,按 分组,得到该项指标值频率分布直方图如图所示.同时发现这200人中有120人在体内产生了抗体,其中该项指标值不小于60的有80人.
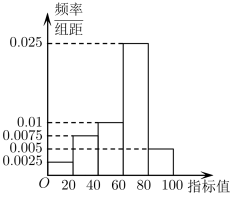
(1)填写下 列联表,判断是否有95%的把握认为“注射疫苗后产生抗体与指标值不小于60有关”.
(2)以注射疫苗后产生抗体的频率作为注射疫苗后产生抗体的概率,若从该地区注射疫苗的人群中随机抽取4人,求产生抗体的人数X的分布列及方差.
附: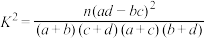 ,其中
,其中 .
.
分组,得到该项指标值频率分布直方图如图所示.同时发现这200人中有120人在体内产生了抗体,其中该项指标值不小于60的有80人.(1)填写下
列联表,判断是否有95%的把握认为“注射疫苗后产生抗体与指标值不小于60有关”.指标值小于60 | 指标值不小于60 | 合计 | |
有抗体 | |||
没有抗体 | |||
合计 |
附:
,其中. | 0.15 | 0.10 | 0.05 | 0.025 | 0.010 | 0.005 | 0.001 |
 | 2.072 | 2.706 | 3.841 | 5.024 | 6.635 | 7.879 | 10.828 |
您最近一年使用:0次


