解题方法
1 . 已知某种汽车新购入价格为 万元,但随着使用年限增加汽车会贬值.通过调查发现使用年限
 (单位:年)与出售价
 (单位:万元)之间的关系有如下一组数据:
(1)求关于的回归方程;
(2)已知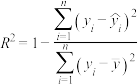 ,当
,当 时,回归方程的拟合效果非常好;当
 时,回归方程的拟合效果良好.试问该线性回归方程的拟合效果是非常好还是良好?说明你的理由.
(附:用最小二乘法求经验回归方程 的系数公式
的系数公式 ;
; )
)
万元,但随着使用年限增加汽车会贬值.通过调查发现使用年限(单位:年)与出售价(单位:万元)之间的关系有如下一组数据:
|
|
|
|
|
|
|
|
|
|
|
|


 关于的回归方程;
(2)已知
,当时,回归方程的拟合效果非常好;当时,回归方程的拟合效果良好.试问该线性回归方程的拟合效果是非常好还是良好?说明你的理由.(附:用最小二乘法求经验回归方程
的系数公式;)
您最近一年使用:0次
2023-06-22更新
|
602次组卷
|
4卷引用:河北省秦皇岛市青龙满族自治县2023届高三联考模拟(三)数学试题
河北省秦皇岛市青龙满族自治县2023届高三联考模拟(三)数学试题河南省郑州市等3地2022-2023学年高三下学期6月冲刺卷(五)全国卷理科数学试题河南省郑州市等3地2022-2023学年高三下学期6月冲刺卷(五)全国卷文科数学试题(已下线)专题04 第八章 成对数据的统计分析--高二期末考点大串讲(人教A版2019)
解题方法
2 . 下面两个图分别是2016年-2020年中国家庭平均每百户汽车拥有量和居民人均可支配年收入柱状图,为了分析居民家庭平均每百户汽车的拥有量与居民人均可支配全年总收入的关系,根据这两个图,绘制每百户汽车拥有量y(单位:辆)与人均可支配收入x(单位:万元)的散点图.

附:线性回归模型 中,
中,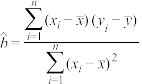 ,
, .
.
(1)由其散点图可以看出,可以用线性回归模型 拟合每百户拥有汽车量关于人均可支配收入的关系,请建立关于的回归方程;
(2)如果从2020年开始,以后每年人均可支配年收入以6%的速度增长,当每百户汽车拥有量达到50辆时,求每百户汽车拥有量平均每年至少增长的速度.
(附: ,
, ,
, ,
, ,
, ,
, ,
, ,
, .)
.)
|
|
|
|
2.82 | 32.56 | 0.46 | 5.27 |


 中,,.
中,,.(1)由其散点图可以看出,可以用线性回归模型
拟合每百户拥有汽车量关于人均可支配收入的关系,请建立关于的回归方程;(2)如果从2020年开始,以后每年人均可支配年收入以6%的速度增长,当每百户汽车拥有量达到50辆时,求每百户汽车拥有量平均每年至少增长的速度.
(附:
,,,,,,,.)
您最近一年使用:0次
2023-04-06更新
|
416次组卷
|
3卷引用:河北省秦皇岛市青龙满族自治县实验中学等2校2023届高三冲刺模拟(二)数学试题
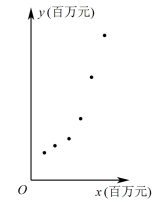
3 . 某企业秉承“科学技术是第一生产力”的发展理念,投入大量科研经费进行技术革新,该企业统计了最近6年投入的年科研经费x(单位:百万元)和年利润y(单位:百万元)的数据,并绘制成如图所示的散点图.已知x,y的平均值分别为 .甲统计员得到的回归方程为
 ;乙统计员得到的回归方程为
 ;若甲、乙二人计算均未出现错误,则以下结论正确的为( )
.甲统计员得到的回归方程为;乙统计员得到的回归方程为;若甲、乙二人计算均未出现错误,则以下结论正确的为( )A.当投入年科研经费为20(百万元)时,按乙统计员的回归方程可得年利润估计值为75.6(百万元)(取 ) ) |
B. |
| C.方程比方程拟合效果好 |
| D.y与x正相关 |
您最近一年使用:0次
2022-09-06更新
|
342次组卷
|
3卷引用:河北省秦皇岛市部分学校2023届高三上学期开学摸底数学试题
4 . 某校2011年到2019年参加“北约”“华约”考试而获得加分的学生人数(每位学生只能参加“北约”“华约”中的一种考试)可以通过以下表格反映出来.(为了方便计算,将2011年编号为1,2012年编号为2,依此类推)
(1)求这九年来,该校参加“北约”“华约”考试而获得加分的学生人数的平均数和方差;
(2)根据最近五年的数据,利用最小二乘法求出y与x的线性回归方程,并依此预测该校2020年参加“北约”“华约”考试而获得加分的学生人数.(最终结果精确至个位)
参考数据:回归直线的方程是 ,其中
,其中 ,
, .
. ,
, .
.
| 年份x | 1 | 2 | 3 | 4 | 5 | 6 | 7 | 8 | 9 |
| 人数y | 2 | 3 | 5 | 4 | 5 | 7 | 8 | 10 | 10 |
(2)根据最近五年的数据,利用最小二乘法求出y与x的线性回归方程,并依此预测该校2020年参加“北约”“华约”考试而获得加分的学生人数.(最终结果精确至个位)
参考数据:回归直线的方程是
,其中,.,.
您最近一年使用:0次
2020-07-09更新
|
409次组卷
|
6卷引用:河北省秦皇岛市2019-2020学年高二下学期开学考试数学试题


