1 . 一般说来,年收入高的家庭年支出也高,你能设计一个方案说明“年收入”与“年支出”是否存在线性相关关系吗?试写出你的设计(答案不唯一)
您最近一年使用:0次
名校
2 . 某商店为了更好地规划某种商品进货的量,该商店从某一年的销售数据中,随机抽取了 组数据作为研究对象,如下图所示(
 (吨)为该商品进货量,
  (天)为销售天数):
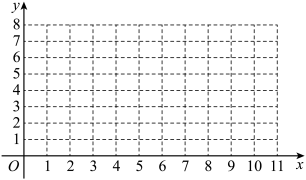
(Ⅰ)根据上表数据在下列网格中绘制散点图;
(Ⅱ)根据上表提供的数据,求出关于的线性回归方程 ;
;
(Ⅲ)在该商品进货量 (吨)不超过6(吨)的前提下任取两个值,求该商品进货量x(吨)恰有一个值不超过3(吨)的概率.
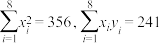
参考公式和数据: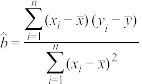 ,
, .
.
组数据作为研究对象,如下图所示((吨)为该商品进货量, (天)为销售天数): | 2 | 3 | 4 | 5 | 6 | 8 | 9 | 11 |
 | 1 | 2 | 3 | 3 | 4 | 5 | 6 | 8 |
(Ⅱ)根据上表提供的数据,求出
关于的线性回归方程;(Ⅲ)在该商品进货量
(吨)不超过6(吨)的前提下任取两个值,求该商品进货量x(吨)恰有一个值不超过3(吨)的概率.参考公式和数据:
,.
您最近一年使用:0次


