名校
1 . 某公司为了研究年宣传费 (单位:千元)对销售量
 (单位:吨)和年利润
 (单位:千元)的影响,搜集了近 8 年的年宣传费
 和年销售量
和年销售量 数据:
数据:
(1)请补齐表格中 8 组数据的散点图,并判断 与
与 中哪一个更适宜作为年销售量关于年宣传费的函数表达式?(给出判断即可,不必说明理由)

(2)若(1)中的 ,且产品的年利润与,的关系为
 ,为使年利润值最大,投入的年宣传费应为何值?
(单位:千元)对销售量(单位:吨)和年利润(单位:千元)的影响,搜集了近 8 年的年宣传费和年销售量数据: | 1 | 2 | 3 | 4 | 5 | 6 | 7 | 8 |
| 38 | 40 | 44 | 46 | 48 | 50 | 52 | 56 |
| 45 | 55 | 61 | 63 | 65 | 66 | 67 | 68 |
(1)请补齐表格中 8 组数据的散点图,并判断
与中哪一个更适宜作为年销售量关于年宣传费的函数表达式?(给出判断即可,不必说明理由)(2)若(1)中的
,且产品的年利润与,的关系为,为使年利润值最大,投入的年宣传费应为何值?
您最近一年使用:0次
2018-02-11更新
|
215次组卷
|
2卷引用:福建省泉州市2017-2018学年高一上学期期末考试数学试题
解题方法
2 . 某校数学建模学生社团进行了一项实验研究,采集了 的一组数据如下表所示:
该社团对上述数据进行了分析,发现与之间具有线性相关关系.
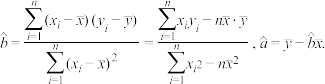
附:在线性回归方程 中,
中,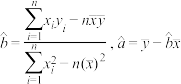 ,其中
,其中 为样本平均值.
(1)画出表中数据的散点图,并指出与之间的相关系数 是正还是负;
(2)求出关于的线性回归方程,并写出当 时,预测数据的值.
的一组数据如下表所示:
| 2 | 3 | 4 | 5 | 6 | 7 |
| 52.5 | 45 | 40 | 30 | 25 | 17.5 |
与之间具有线性相关关系.附:在线性回归方程
中,,其中为样本平均值.(1)画出表中数据的散点图,并指出
与之间的相关系数是正还是负;(2)求出
关于的线性回归方程,并写出当时,预测数据的值.
您最近一年使用:0次
3 . 若变量,有如下观察的数据:
(1)画出散点图;
(2)判断变量 ,
, 是否具有相关关系?如果具有相关关系,那么是正相关还是负相关?
,有如下观察的数据:
| 151 | 152 | 153 | 154 | 156 | 157 | 158 | 159 | 160 | 162 | 163 | 164 |
| 40 | 41 | 41 | 41.5 | 42 | 42.5 | 43 | 44 | 45 | 45 | 46 | 45.5 |
(2)判断变量
,是否具有相关关系?如果具有相关关系,那么是正相关还是负相关?
您最近一年使用:0次
解题方法
4 . 随着网络的普及,网上购物的方式已经受到越来越多年轻人的青睐,某家网络店铺商品的成交量x(件)与店铺的浏览y(次)之间的对应数据如下表所示:
(1)画出表中数据的散点图;
(2)根据表中的数据,求出y关于x的回归直线方程;
(3)当这种商品的成交量突破100件(含100件)时,预测这家店铺的浏览量至少为多少.
x/件 | 2 | 4 | 5 | 6 | 8 |
y/次 | 30 | 40 | 50 | 60 | 70 |
(2)根据表中的数据,求出y关于x的回归直线方程;
(3)当这种商品的成交量突破100件(含100件)时,预测这家店铺的浏览量至少为多少.
您最近一年使用:0次
解题方法
5 . 下表提供了某厂节能降耗技术改造后生产甲产品过程中记录的产量x(吨)与相应的生产能耗y(吨标准煤)的几组对应数据:
(1)画出散点图;
(2)请根据上表提供的数据,求y关于x的线性回归方程.
x | 3 | 4 | 5 | 6 |
y | 2.5 | 3 | 4 | 4.5 |
(2)请根据上表提供的数据,求y关于x的线性回归方程.
您最近一年使用:0次
2024高三上·全国·专题练习
解题方法
6 . 某校数学建模学生社团进行了一项实验研究,采集了的一组数据如下表所示:
该社团对上述数据进行了分析,发现与之间具有线性相关关系.
(1)画出表中数据的散点图,并指出与之间的相关系数是正还是负;
(2)求出关于的线性回归方程,并写出当时,预测数据的值.
附:在线性回归方程 中,,其中为样本平均值.
的一组数据如下表所示:
| 2 | 3 | 4 | 5 | 6 | 7 |
| 52.5 | 45 | 40 | 30 | 25 | 17.5 |
与之间具有线性相关关系.(1)画出表中数据的散点图,并指出
与之间的相关系数是正还是负;(2)求出
关于的线性回归方程,并写出当时,预测数据的值.附:在线性回归方程
中,,其中为样本平均值.
您最近一年使用:0次
解题方法
7 . 某车间为了规定工时定额,需要确定加工零件所花费的时间,为此作了四次试验,得到的数据如表:
 ,
,
(1)在给定的坐标系中画出表中数据的散点图;
(2)求出关于的线性回归方程 ;
;
(3)预测加工10个零件需要多少小时?
| 零件的个数x(个) | 2 | 3 | 4 | 5 |
| 加工的时间y(小时) | 2.5 | 3 | 4 | 4.5 |
,(1)在给定的坐标系中画出表中数据的散点图;
(2)求出
关于的线性回归方程;(3)预测加工10个零件需要多少小时?
您最近一年使用:0次
2023-12-11更新
|
352次组卷
|
3卷引用:新疆哈密市第八中学2021-2022学年高二上学期期末考试数学(文)试题
新疆哈密市第八中学2021-2022学年高二上学期期末考试数学(文)试题新疆哈密市第八中学2021-2022学年高二上学期期末数学(理)试题(已下线)专题05选择性必修三+选择性必修四期末考点汇总(12题型)-1
8 . 某种产品的广告费用支出与销售额(单位:万元)之间有如下的对应数据:
(1)根据上表中的数据画出散点图;
(2)如果近似量存在线性关系,求拟合直线的方程.
(3)试预测广告费用支出为10万元时,销售额多大?
与销售额(单位:万元)之间有如下的对应数据:
| 2 | 4 | 5 | 6 | 8 |
| 30 | 40 | 60 | 50 | 70 |
(2)如果近似量存在线性关系,求拟合直线的方程.
(3)试预测广告费用支出为10万元时,销售额多大?
您最近一年使用:0次
名校
解题方法
9 . 某连锁经营公司所属5个零售店某月的销售额和利润额资料如下表:
(1)画出散点图,观察散点图,说明两个变量有怎样的相关性;

(2)用最小二乘法计算利润额y对销售额x的回归直线方程;
(3)当销售额为4(千万元)时,估计利润额的大小.
参考公式: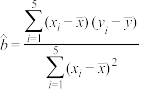 ,
, ,
, .
.
| 商店名称 | A | B |  |  | E |
| 销售额x/千万元 | 3 | 5 | 6 | 7 | 9 |
| 利润额y/百万元 | 2 | 3 | 3 | 4 | 5 |
(2)用最小二乘法计算利润额y对销售额x的回归直线方程;
(3)当销售额为4(千万元)时,估计利润额的大小.
参考公式:
,,.
您最近一年使用:0次
解题方法
10 . 为研究拉力 对弹簧长度
对弹簧长度 的影响,对不同拉力的6根弹簧进行测量,测得如下表中的数据:
(1)画出散点图;
(2)如果散点图中的各点大致分布在一条直线的附近,求Y关于X的线性回归方程.
对弹簧长度的影响,对不同拉力的6根弹簧进行测量,测得如下表中的数据:X | 5 | 10 | 15 | 20 | 25 | 30 |
Y | 7.25 | 8.12 | 8.95 | 9.9 | 10.9 | 11.8 |
(2)如果散点图中的各点大致分布在一条直线的附近,求Y关于X的线性回归方程.
您最近一年使用:0次


