某市2011年至2017年新开楼盘的平均销售价格(单位:千元/平方米)的统计数据如下表:
附:参考公式: ,
, ,其中
,其中 为样本平均值.
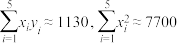
参考数据: ,
, .
.
(1)求 关于
关于 的线性回归方程;
(2)利用(1)中的回归方程,分析2011年至2017年该市新开楼盘平均销售价格的变化情况,并预测该市2019年新开楼盘的平均销售价格.
| 年份 | 2011 | 2012 | 2013 | 2014 | 2015 | 2016 | 2017 |
| 年份代号 | 1 | 2 | 3 | 4 | 5 | 6 | 7 |
| 销售价格 | 3 | 3.4 | 3.7 | 4.5 | 4.9 | 5.3 | 6 |
,,其中为样本平均值.参考数据:
,.(1)求
关于的线性回归方程;(2)利用(1)中的回归方程,分析2011年至2017年该市新开楼盘平均销售价格的变化情况,并预测该市2019年新开楼盘的平均销售价格.
更新时间:2019-05-11 13:04:13
|
相似题推荐
解答题-应用题
|
适中
(0.65)
名校
解题方法
【推荐1】某食品厂2021年2月至6月的某款果味饮料生产产量(单位:万瓶)的数据如表:
(1)根据以上数据,求关于的线性回归方程 ;
;
(2)调查显示该年7月份的实际市场需求量为13.5万件,求该年7月份所得回归方程预测的生产产量与实际市场需求量的误差.
附:(参考公式: ;
; ;).
;).
| 2 | 3 | 4 | 5 | 6 |
| 3 | 5 | 6.5 | 8 | 10.5 |
关于的线性回归方程;(2)调查显示该年7月份的实际市场需求量为13.5万件,求该年7月份所得回归方程预测的生产产量与实际市场需求量的误差.
附:(参考公式:
;;).
您最近一年使用:0次
解答题-应用题
|
适中
(0.65)
名校
解题方法
【推荐2】某社区居民2013年至2019年人均收入(万元)的统计数据如下表:
已知变量 具有线性相关关系.
(1)求关于的线性回归方程;
(2)利用(1)中的线性回归方程,分析2013年至2019年该社区居民人均收入的变化情况,并预测该社区居民2020年的人均收入.
附参考公式:线性回归方程  .
.
(万元)的统计数据如下表:| 年份 | 2013 | 2014 | 2015 | 2016 | 2017 | 2018 | 2019 |
| 年份代号 | 1 | 2 | 3 | 4 | 5 | 6 | 7 |
| 人均收入 | 2.9 | 3.3 | 3.6 | 4.4 | 4.8 | 5.2 | 5.9 |
具有线性相关关系.(1)求
关于的线性回归方程;(2)利用(1)中的线性回归方程,分析2013年至2019年该社区居民人均收入的变化情况,并预测该社区居民2020年的人均收入.
附参考公式:线性回归方程
.
您最近一年使用:0次
解答题-应用题
|
适中
(0.65)
名校
解题方法
【推荐3】某保险公司研究一款畅销保险产品的保费与销量之间的关系,根据历史经验,若每份保单的保费在 元的基础上每增加元,对应的销量(万份)与(元)有较强线性相关关系,从历史销售记录中抽样得到如下
 组与的对应数据:
(1)试据此求出关于的线性回归方程 ;
;
(2)若把回归方程当作与的线性关系,试计算每份保单的保费定为多少元此产品的保费总收入最大,并求出该最大值;
参考公式:
参考数据:
元的基础上每增加元,对应的销量(万份)与(元)有较强线性相关关系,从历史销售记录中抽样得到如下组与的对应数据:| (元) | 25 | 30 | 38 | 45 | 52 |
| 销量(万份) | 7.5 | 7.1 | 6.0 | 5.6 | 4.8 |
关于的线性回归方程;(2)若把回归方程当作
与的线性关系,试计算每份保单的保费定为多少元此产品的保费总收入最大,并求出该最大值;参考公式:
参考数据:
您最近一年使用:0次
解答题-作图题
|
适中
(0.65)
名校
解题方法
【推荐1】下表是某学生在4月份开始进入冲刺复习至高考前的5次大型联考数学成绩(分);
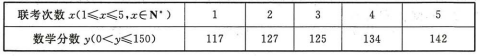
(1)请画出上表数据的散点图;

(2)①请根据上表提供的数据,用最小二乘法求出关于的线性回归方程;
②若在4月份开始进入冲刺复习前,该生的数学分数最好为116分,并以此作为初始分数,利用上述回归方程预测高考的数学成绩,并以预测高考成绩作为最终成绩,求该生4月份后复习提高率.(复习提高率=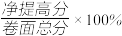 ,分数取整数)
附:回归直线的斜率和截距的最小二乘估计公式分别为 ,
, .
.
(1)请画出上表数据的散点图;
(2)①请根据上表提供的数据,用最小二乘法求出
关于的线性回归方程;②若在4月份开始进入冲刺复习前,该生的数学分数最好为116分,并以此作为初始分数,利用上述回归方程预测高考的数学成绩,并以预测高考成绩作为最终成绩,求该生4月份后复习提高率.(复习提高率=
,分数取整数)附:回归直线的斜率和截距的最小二乘估计公式分别为
,.
您最近一年使用:0次
解答题-问答题
|
适中
(0.65)
【推荐2】某校高二2班学生每周用于数学学习的时间(单位: )与数学成绩(单位:分)之间有如表数据:
(Ⅰ)求线性回归方程;
(Ⅱ)该班某同学每周用于数学学习的时间为18小时,试预测该生数学成绩.
参考数据: ,
, ,
, ,
, ,
,
回归直线方程参考公式: ,
,
(单位:)与数学成绩(单位:分)之间有如表数据:
| 24 | 15 | 23 | 19 | 16 | 11 | 20 | 16 | 17 | 13 |
| 92 | 79 | 97 | 89 | 64 | 47 | 83 | 68 | 71 | 59 |
(Ⅱ)该班某同学每周用于数学学习的时间为18小时,试预测该生数学成绩.
参考数据:
,,,,回归直线方程参考公式:
,
您最近一年使用:0次
解答题-问答题
|
适中
(0.65)
名校
【推荐3】发展扶贫产业,找准路子是关系,重庆市石柱土家族自治县中益乡华溪村不仅找准了路,还将当地打造成了种植中药材黄精的产业示范基地.通过种植黄精,华溪村村民的收逐年递增.以下是2013年至2019年华溪村村民每户平均可支配收入的统计数据:
根据以上数据,绘制如图所示的散点图:

(1)根据散点图判断, 与
与 哪一个更适宜作为每户平均可支配收入y(千元)关于年份代码x的回归方程模型(给出判断即可,不必说明理由),并建立y关于x的回归方程(结果保留1位小数);
(2)根据(1)建立的回归方程,试预测要到哪一年华溪村的每户平均可支配收入才能超过35(千元)?
(3)从2013年至2019年中任选两年,求事件A:“恰有一年的每户平均可支配收入超过22(千元)”的概率.
参考数据:其中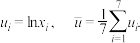
参考公式:线性回归方程 中,
中,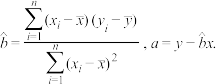
| 年份 | 2013 | 2014 | 2015 | 2016 | 2017 | 2018 | 2019 |
| 年份代码x | 1 | 2 | 3 | 4 | 5 | 6 | 7 |
| 每户平均可支配收y(千元) | 4 | 15 | 22 | 26 | 29 | 31 | 32 |
(1)根据散点图判断,
与哪一个更适宜作为每户平均可支配收入y(千元)关于年份代码x的回归方程模型(给出判断即可,不必说明理由),并建立y关于x的回归方程(结果保留1位小数);(2)根据(1)建立的回归方程,试预测要到哪一年华溪村的每户平均可支配收入才能超过35(千元)?
(3)从2013年至2019年中任选两年,求事件A:“恰有一年的每户平均可支配收入超过22(千元)”的概率.
参考数据:其中
参考公式:线性回归方程
中, |  |  |  |  |  |
 |  |  |  |  |  |
您最近一年使用:0次


