有人收集了春节期间平均气温 与某取暖商品销售额
 的有关数据,如下表所示.
(1)根据以上数据,用最小二乘法求出回归方程 ;
;
(2)预测平均气温为 时,该商品的销售额为多少万元.
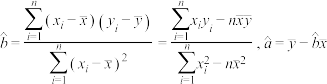 .
.
与某取暖商品销售额的有关数据,如下表所示.平均气温 |  |  |  |  |
| 销售额/万元 |  |  |  |  |
;(2)预测平均气温为
时,该商品的销售额为多少万元..
更新时间:2019-08-13 21:22:31
|
相似题推荐
解答题-应用题
|
适中
(0.65)
名校
解题方法
【推荐1】随着我国经济的高速发展,汽车的销量也快速增加,每年因道路交通安全事故造成伤亡人数超过万人,根据国家质量监督检验检疫局发布的《车辆驾驶人员血液、呼气酒精含量阀值与检验》( -醉驾车的测试
 )的规定:饮酒驾车是指车辆驾驶人员血液中的酒精含量大于或者等于
 ,小于
,小于 的驾驶行为;醉酒驾车是指车辆驾驶人员血液中的酒精含量大于或者等于的驾驶行为,某市交通部门从
 年饮酒后驾驶机动车辆发生交通事故的驾驶员中随机抽查了
 人进行统计,得到如下数据:
已知从这人中任意抽取两人,两人均是醉酒驾车的概率是 .
.
(1)求 ,
, 的值;
的值;
(2)实践证明,驾驶人员血液中的酒精含量与发生交通事故的人数具有线性相关性,试建立关于的线性回归方程;
(3)试预测,驾驶人员血液中的酒精含量为多少时,发生交通事故的人数会超过取样人数的 ?
?
参考数据: ,
,
回归直线方程 中系数计算公式
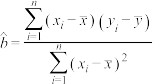 ,
, .
.
万人,根据国家质量监督检验检疫局发布的《车辆驾驶人员血液、呼气酒精含量阀值与检验》(-醉驾车的测试)的规定:饮酒驾车是指车辆驾驶人员血液中的酒精含量大于或者等于,小于的驾驶行为;醉酒驾车是指车辆驾驶人员血液中的酒精含量大于或者等于的驾驶行为,某市交通部门从年饮酒后驾驶机动车辆发生交通事故的驾驶员中随机抽查了人进行统计,得到如下数据:酒精含量
|
|
|
|
|
|
发生交通事故的人数 |
|
|
|
|
|


 人中任意抽取两人,两人均是醉酒驾车的概率是.
(1)求
,的值;(2)实践证明,驾驶人员血液中的酒精含量与发生交通事故的人数具有线性相关性,试建立
关于的线性回归方程;(3)试预测,驾驶人员血液中的酒精含量为多少时,发生交通事故的人数会超过取样人数的
?参考数据:
,回归直线方程
中系数计算公式,.
您最近一年使用:0次
解答题-问答题
|
适中
(0.65)
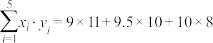
【推荐2】“奶茶妹妹”对某时间段的奶茶销售量及其价格进行调查,统计出售价和销售量之间的一组数据如下表所示:
通过分析,发现销售量对奶茶的价格具有线性相关关系.
(1)求销售量对奶茶的价格的回归直线方程;
(2)若将出售价定为5元,请预测奶茶妹妹能销售多少杯奶茶.
注:回归直线方程 中:
中: ,
, ;
;
 ,
, .
.
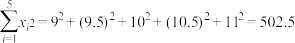
和销售量之间的一组数据如下表所示:价格 | 9 | 9.5 | 10 | 10.5 | 11 |
销售量 | 11 | 10 | 8 | 6 | 5 |
对奶茶的价格具有线性相关关系.(1)求销售量
对奶茶的价格的回归直线方程;(2)若将出售价定为5元,请预测奶茶妹妹能销售多少杯奶茶.
注:回归直线方程
中:,;,.
您最近一年使用:0次
解答题-问答题
|
适中
(0.65)
名校
【推荐3】某百货商店今年春节期间举行促销活动,规定消费达到一定标准的顾客可进行一次抽奖活动,随着抽奖活动的有效开展,参与抽奖活动的人数越来越多,该商店经理对春节前 天参加抽奖活动的人数进行统计,表示第天参加抽奖活动的人数,得到统计表格如下:
(1)经过进一步统计分析,发现与具有线性相关关系.请根据上表提供的数据,用最小二乘法求出关于的线性回归方程 ;
;
(2)该商店规定:若抽中“一等奖”,可领取600元购物券;抽中“二等奖”可领取300元购物券;抽中“谢谢惠顾”,则没有购物券.已知一次抽奖活动获得“一等奖”的概率为 ,获得“二等奖”的概率为
 .现有张、王两位先生参与了本次活动,且他们是否中奖相互独立,求此二人所获购物券总金额
 的分布列及数学期望.
参考公式: ,,
,, ,
, .
.
天参加抽奖活动的人数进行统计,表示第天参加抽奖活动的人数,得到统计表格如下: | 1 | 2 | 3 | 4 | 5 | 6 | 7 |
| 5 | 8 | 8 | 10 | 14 | 15 | 17 |
与具有线性相关关系.请根据上表提供的数据,用最小二乘法求出关于的线性回归方程;(2)该商店规定:若抽中“一等奖”,可领取600元购物券;抽中“二等奖”可领取300元购物券;抽中“谢谢惠顾”,则没有购物券.已知一次抽奖活动获得“一等奖”的概率为
,获得“二等奖”的概率为.现有张、王两位先生参与了本次活动,且他们是否中奖相互独立,求此二人所获购物券总金额的分布列及数学期望.参考公式:
,,,.
您最近一年使用:0次
解答题-问答题
|
适中
(0.65)
解题方法
【推荐1】班主任想对本班学生的考试成绩进行分析,决定从全班 名女同学,
名女同学, 名男同学中随机抽取一个容量为
 的样本进行分析.
(1)如果按性别比例分层抽样,男、女生各抽取多少位才符合抽样要求?
(2)随机抽出位,他们的数学、地理成绩对应如下表:
①.若规定 分以上(包括分)为优秀,在该班随机调查一位同学,该同学的数学和地理成绩均为优秀的概率是多少?
②.根据上表,用变量与的相关系数或用散点图说明地理成绩与数学成绩之间线性相关关系的强弱.如果有较强的线性相关关系,求出与的线性回归方程(系数精确到 );如果不具有线性相关关系,说明理由.
参考公式:
相关系数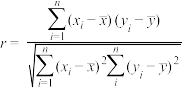 ;回归直线的方程是:
 ,
,
其中 ,
, ,
, 是与
是与 对应的回归估计值.
参考数据: ,
, ,
,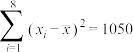 ,
, ,
,
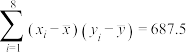 ,
, ,
, ,
,
名女同学,名男同学中随机抽取一个容量为的样本进行分析.(1)如果按性别比例分层抽样,男、女生各抽取多少位才符合抽样要求?
(2)随机抽出
位,他们的数学、地理成绩对应如下表:| 学生编号 | 1 | 2 | 3 | 4 | 5 | 6 | 7 | 8 |
| 数学成绩 | 60 | 65 | 70 | 75 | 80 | 85 | 90 | 95 |
| 地理成绩 | 72 | 77 | 80 | 84 | 88 | 90 | 93 | 95 |
分以上(包括分)为优秀,在该班随机调查一位同学,该同学的数学和地理成绩均为优秀的概率是多少?②.根据上表,用变量
与的相关系数或用散点图说明地理成绩与数学成绩之间线性相关关系的强弱.如果有较强的线性相关关系,求出与的线性回归方程(系数精确到);如果不具有线性相关关系,说明理由.参考公式:
相关系数
;回归直线的方程是:,其中
,,是与对应的回归估计值.参考数据:
,,,,,,,
您最近一年使用:0次
解答题-应用题
|
适中
(0.65)
解题方法
【推荐2】根据我市房地产数据显示,今年我市前5个月新建住宅销售均价逐月上升,为抑制房价过快上涨,政府从6月份开始推出限价房等宏观调控措施,6月份开始房价得到很好的抑制,房价回落.今年前10个月的房价均价如表:
地产数据研究发现,从1月份至5月份的各月均价y(万元/平方米)与x之间具有正线性相关关系,从6月份至10月份的各月均价y(万元/平方米)与x之间具有负线性相关关系.
(1)若政府不调控,根据前5个月的数据,求y关于x的回归直线方程,并预测12月份的房地产均价.(精确到0.01)
(2)政府调控后,从6月份至10月份的数据可得到y与x的回归直线方程为: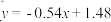 .由此预测政府调控后12月份的房地产均价.说明政府调控的必要性.(精确到0.01)
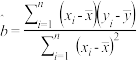 ;
; ;
;
月份x | 1 | 2 | 3 | 4 | 5 | 6 | 7 | 8 | 9 | 10 |
均价y(万元/平方米) | 0.83 | 0.95 | 1.00 | 1.05 | 1.17 | 1.15 | 1.10 | 1.06 | 0.98 | 0.94 |
(1)若政府不调控,根据前5个月的数据,求y关于x的回归直线方程,并预测12月份的房地产均价.(精确到0.01)
(2)政府调控后,从6月份至10月份的数据可得到y与x的回归直线方程为:
.由此预测政府调控后12月份的房地产均价.说明政府调控的必要性.(精确到0.01);;
您最近一年使用:0次
解答题-问答题
|
适中
(0.65)
【推荐3】某市食品药品监督管理局开展2020年春季快递餐饮安全检查,对本市的8个快递配餐点进行了原料采购加工标准和卫生标准的检查和评分,其评分情况如表所示:
(1)已知与之间具有线性相关关系,求关于的线性回归方程;(精确到0.1)
(2)现从8个被检查点中任意抽取两个组成一组,若两个点的原料采购加工标准和卫生标准的评分均超过80分,则组成“快递标兵配餐点”,求该组被评为“快递标兵配餐点”的概率.
参考公式: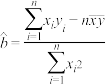 ,
, ;参考数据:
 ,
, .
.
| 快递配餐点编号 | 1 | 2 | 3 | 4 | 5 | 6 | 7 | 8 |
| 原料采购加工标准评分 | 82 | 75 | 70 | 66 | 83 | 93 | 95 | 100 |
| 卫生标准评分 | 81 | 79 | 77 | 75 | 82 | 83 | 84 | 87 |
与之间具有线性相关关系,求关于的线性回归方程;(精确到0.1)(2)现从8个被检查点中任意抽取两个组成一组,若两个点的原料采购加工标准和卫生标准的评分均超过80分,则组成“快递标兵配餐点”,求该组被评为“快递标兵配餐点”的概率.
参考公式:
,;参考数据:,.
您最近一年使用:0次


