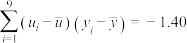
下面给出了根据我国2012年~2018年水果人均占有量 (单位:
(单位: )和年份代码
 绘制的散点图和线性回归方程的残差图(2012年~2018年的年份代码分别为1~7).
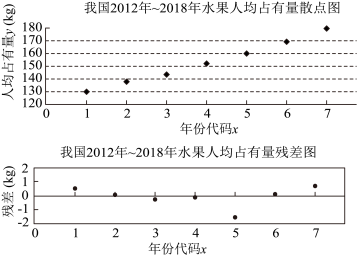
(1)根据散点图分析与之间的相关关系;
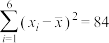
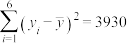
(2)根据散点图相应数据计算得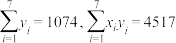 ,求关于的线性回归方程;
(3)根据线性回归方程的残差图,分析线性回归方程的拟合效果.(精确到0.01)
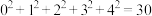
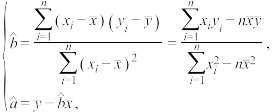
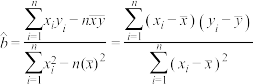
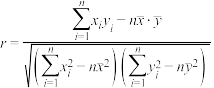
附:回归方程 中斜率和截距的最小二乘估计公式分别为:
 .
.
(单位:)和年份代码绘制的散点图和线性回归方程的残差图(2012年~2018年的年份代码分别为1~7).(1)根据散点图分析
与之间的相关关系;(2)根据散点图相应数据计算得
,求关于的线性回归方程;(3)根据线性回归方程的残差图,分析线性回归方程的拟合效果.(精确到0.01)
附:回归方程
中斜率和截距的最小二乘估计公式分别为:.
2020·山东·一模 查看更多[3]
2020届山东省高考模拟考试数学试题(2019年12月)(已下线)第八章 成对数据的统计分析(提高卷)-《阳光测评》2020-2021学年高二数学单元提升卷(人教A版2019选择性必修第三册)(已下线)FHsx1225yl137
更新时间:2019-12-04 16:06:14
|
相似题推荐
解答题-应用题
|
适中
(0.65)
名校
解题方法
【推荐1】某连锁经营公司所属5个零售店某月的销售额和利润额资料如下表:
(1)画出散点图,观察散点图,说明两个变量有怎样的相关性;

(2)用最小二乘法计算利润额y对销售额x的回归直线方程;
(3)当销售额为4(千万元)时,估计利润额的大小.
参考公式: ,
, ,
, .
.
| 商店名称 | A | B |  |  | E |
| 销售额x/千万元 | 3 | 5 | 6 | 7 | 9 |
| 利润额y/百万元 | 2 | 3 | 3 | 4 | 5 |
(2)用最小二乘法计算利润额y对销售额x的回归直线方程;
(3)当销售额为4(千万元)时,估计利润额的大小.
参考公式:
,,.
您最近一年使用:0次
解答题-问答题
|
适中
(0.65)
名校
【推荐2】某地区在一次考试后,从全体考生中随机抽取44名,获取他们本次考试的数学成绩(x)和物理成绩(y),绘制成如图散点图: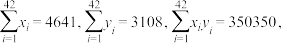

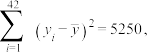 其中xi,yi分别表示这42名同学的数学成绩、物理成绩,i=1,2,…,42,y与x的相关系数r=0.82.
(1)若不剔除A,B两名考生的数据,用44组数据作回归分析,设此时y与x的相关系数为r0.试判断r0与r的大小关系,并说明理由;
(2)求y关于x的线性回归方程(系数精确到0.01),并估计如果B考生加了这次物理考试(已知B考生的数学成绩为125分),物理成绩是多少?(精确到个位);
(3)从概率统计规律看,本次考试该地区的物理成绩ξ服从正态分布 ,以剔除后的物理成绩作为样本,用样本平均数
 作为μ的估计值,用样本方差s2作为σ2的估计值.试求该地区5000名考生中,物理成绩位于区间(62.8,85.2)的人数Z的数学期望.
附:①回归方程中: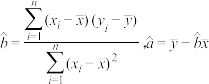
②若 ,则
,则
③ 11.2
11.2
其中xi,yi分别表示这42名同学的数学成绩、物理成绩,i=1,2,…,42,y与x的相关系数r=0.82.(1)若不剔除A,B两名考生的数据,用44组数据作回归分析,设此时y与x的相关系数为r0.试判断r0与r的大小关系,并说明理由;
(2)求y关于x的线性回归方程(系数精确到0.01),并估计如果B考生加了这次物理考试(已知B考生的数学成绩为125分),物理成绩是多少?(精确到个位);
(3)从概率统计规律看,本次考试该地区的物理成绩ξ服从正态分布
,以剔除后的物理成绩作为样本,用样本平均数作为μ的估计值,用样本方差s2作为σ2的估计值.试求该地区5000名考生中,物理成绩位于区间(62.8,85.2)的人数Z的数学期望.附:①回归方程
中:②若
,则③
11.2
您最近一年使用:0次
 (年)
(年) ,
, )
)
解答题-问答题
|
适中
(0.65)
【推荐1】某电器公司的市场调研人员为了改进和评价市场营销方案,对该公司某种产品最近五个月内的市场占有率进行了统计,结果如表所示:
(1)从上述五个月份中随机抽取两个月,求该种产品市场占有率均超过10%的概率;
(2)求关于的线性回归方程,并预测何时该种产品的市场占有率超过35%.
参考公式:回归直线的斜率和截距的最小二乘法估计公式分别为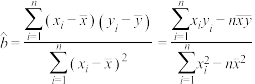 ,
,
年份 | 2021年 | ||||
月份 | 8月 | 9月 | 10月 | 11月 | 12月 |
月份代码 | 1 | 2 | 3 | 4 | 5 |
市场占有率y(%) | 8 | 10 | 13 | 20 | 24 |
(2)求
关于的线性回归方程,并预测何时该种产品的市场占有率超过35%.参考公式:回归直线的斜率和截距的最小二乘法估计公式分别为
,
您最近一年使用:0次
解答题-应用题
|
适中
(0.65)
名校
【推荐2】红铃虫是棉花的主要害虫之一,能对农作物造成严重伤害.每只红铃虫的平均产卵数y(个)和平均温度x(℃)有关,现收集了7组数据,得到下面的散点图及一些统计量的值. 与
与 (其中e为自然对数的底数)哪一个更适合作为平均产卵数y(个)关于平均温度(℃)的回归方程类型?(给出判断即可,不必说明理由)并由判断结果及表中数据,求出关于的回归方程;
附:回归方程 中,
中,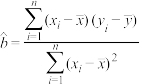 .
.
(2)现在有10根棉花纤维,其中有6根为长纤维,4根为短纤维,从中随机抽取3根棉花纤维,设抽到的长纤维棉花的根数为X,求X的分布列.
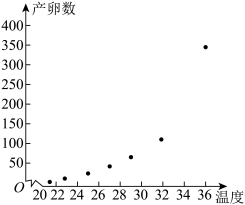
与(其中e为自然对数的底数)哪一个更适合作为平均产卵数y(个)关于平均温度(℃)的回归方程类型?(给出判断即可,不必说明理由)并由判断结果及表中数据,求出关于的回归方程;附:回归方程
中,.参考数据 | |||||
|
|
|
|
|
|
5215 | 2347.3 | 33.6 | 27 | 81.3 | 3.6 |


您最近一年使用:0次
解答题-问答题
|
适中
(0.65)
名校
【推荐3】进入春天,大气流动性变好,空气质量随之提高,自然风光越来越美,自驾游乡村游也就越来越热.某旅游景区试图探究车流量与景区接待能力的相关性,确保服务质量和游客安全,以便于确定是否对进入景区车辆实施限行.为此,该景区采集到过去一周内某时段车流量与接待能力指数的数据如表:
(I)根据表中周一到周五的数据,求y关于x的线性回归方程.
(Ⅱ)若由线性回归方程得到的估计数据与所选出的检验数据的误差均不超过2,则认为该线性回归方程是可靠的.请根据周六和周日数据,判定所得的线性回归方程是否可靠?
附参考公式及参考数据:线性回归方程 ,其中
,其中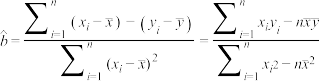 ;
;
| 时间 | 周一 | 周二 | 周三 | 周四 | 周五 | 周六 | 周日 |
| 车流量(x千辆) | 10 | 9 | 9.5 | 10.5 | 11 | 8 | 8.5 |
| 接待能力指数y | 78 | 76 | 77 | 79 | 80 | 73 | 75 |
(Ⅱ)若由线性回归方程得到的估计数据与所选出的检验数据的误差均不超过2,则认为该线性回归方程是可靠的.请根据周六和周日数据,判定所得的线性回归方程是否可靠?
附参考公式及参考数据:线性回归方程
,其中;
您最近一年使用:0次
解答题-问答题
|
适中
(0.65)
名校
【推荐1】设某地区乡居民人民币储蓄存款(年底余额)如下表:
(1)求关于x的回归方程,并预测该地区2019年的人民币储蓄存款(用最简分数作答).
(2)在含有一个解释变量的线性模型中, 恰好等于相关系数r的平方,当
 时,认为线性回归模型是有效的,请计算并且评价模型的拟合效果(计算结果精确到0.001).
附:
 ,
,

| 年份 | 2012 | 2013 | 2014 | 2015 | 2016 | 2017 |
| 时间代号x | 1 | 2 | 3 | 4 | 5 | 6 |
| 储蓄存款y(千亿元) | 3.5 | 5 | 6 | 7 | 8 | 9.5 |
,并预测该地区2019年的人民币储蓄存款(用最简分数作答).(2)在含有一个解释变量的线性模型中,
恰好等于相关系数r的平方,当时,认为线性回归模型是有效的,请计算并且评价模型的拟合效果(计算结果精确到0.001).附:
,
您最近一年使用:0次
解答题-问答题
|
适中
(0.65)
解题方法
【推荐2】为响应党中央“扶贫攻坚”的号召,某单位指导一贫困村通过种植紫甘薯来提高经济收入.紫甘薯对环境温度要求较高,根据以往的经验,随着温度的升高,其死亡株数成增长的趋势.下表给出了2019年种植的一批试验紫甘薯在温度升高时6组死亡的株数.
经计算, ,
, ,
, ,
, ,
,
 ,
, ,
, ,其中
,其中 ,
, 分别为试验数据中的温度和死亡株数,
 .
.
(1)若用一元线性回归模型,求关于的经验回归方程(结果精确到0.1);
(2)若用非线性回归模型求得关于的非线性经验回归方程 ,且相关指数为
 .
.
(i)试与(1)中的回归模型相比,用说明哪种模型的拟合效果更好;
(ii)用拟合效果好的模型预测温度为35℃时该批紫甘薯的死亡株数(结果取整数).
| 温度/℃ | 21 | 23 | 24 | 27 | 29 | 30 |
| 死亡数/株 | 6 | 11 | 20 | 27 | 57 | 77 |
,,,,,,,其中,分别为试验数据中的温度和死亡株数,.(1)若用一元线性回归模型,求
关于的经验回归方程(结果精确到0.1);(2)若用非线性回归模型求得
关于的非线性经验回归方程,且相关指数为.(i)试与(1)中的回归模型相比,用
说明哪种模型的拟合效果更好;(ii)用拟合效果好的模型预测温度为35℃时该批紫甘薯的死亡株数(结果取整数).
您最近一年使用:0次
解答题-问答题
|
适中
(0.65)
【推荐3】为践行“绿水青山就是金山银山”的生态文明发展理念,某市环保部门对某大型企业进行排放物监控.测得排放的可吸入颗粒物浓度(单位: )、监控点与企业的距离(单位:
 )的数据,并进行了初步处理,得到了下面的一些统计量的值(其中
 ,
, ):
): ,
, ,
, ,
, ,
, ,
, ,
, ,
, .
.
(1)利用相关系数,判断 与
与 哪一个更适合作为可吸入颗粒物浓度关于监控点与该企业距离的回归方程类型?(精确到0.001)
(计算过程中的可参考数据: ,
, )
)
(2)根据(1)的判断结果,求其回归方程,并预测当 时可吸入颗粒物浓度的预报值?
附:对于一组数据 ,
, ,…,
,…, ,其线性相关系数为:
 ,
,
回归直线方程 的斜率和截距的最小二乘估计分别为:
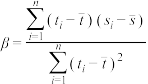 ,
, .
.
(单位:)、监控点与企业的距离(单位:)的数据,并进行了初步处理,得到了下面的一些统计量的值(其中,):,,,,,,,.(1)利用相关系数,判断
与哪一个更适合作为可吸入颗粒物浓度关于监控点与该企业距离的回归方程类型?(精确到0.001)(计算过程中的可参考数据:
,)(2)根据(1)的判断结果,求其回归方程,并预测当
时可吸入颗粒物浓度的预报值?附:对于一组数据
,,…,,其线性相关系数为:,回归直线方程
的斜率和截距的最小二乘估计分别为:,.
您最近一年使用:0次


