1 . 相互独立事件
事件A(或B)是否发生对事件B(或A)发生的概率没有影响,这样的两个事件叫作______ .
两个相互独立事件同时发生的概率
______ .
事件A(或B)是否发生对事件B(或A)发生的概率没有影响,这样的两个事件叫作
两个相互独立事件同时发生的概率
您最近一年使用:0次
2 . 正态曲线及其性质
(1)正态曲线:我们称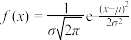 ,
, ,其中
,其中 ,
, 时为参数,为正态密度函数,称它的图象为正态密度曲线,简称正态曲线.
(2)正态分布:若随机变量X的概率分布密度函数为 ,则称随机变量X服从正态分布,记为
_________ .特别地,当 ,
, 时,称随机变量X服从
________ 正态分布.
(3)正态分布的期望与方差:若 ,则
,则
______ ,
_______ .
(4)正态曲线的特点:
①非负性:对 ,
, ,它的图象在x轴的上方.
②定值性:曲线与x轴之间的面积为1.
③对称性:曲线是单峰的,它关于直线________ 对称.
④最大值:曲线在 处达到峰值
处达到峰值 .
.
⑤当 无限增大时,曲线无限接近x轴.
⑥当 一定时,曲线的位置由
 确定,曲线随着的变化而沿
 轴平移,如图①.
⑦当一定时,曲线的形状由确定,较小时曲线“瘦高”,表示随机变量X的分布比较集中;较大时,曲线“矮胖”,表示随机变量X的分布比较分散,如图②.,如图所示,X取值不超过的概率 为图中区域A的面积,而
 为区域B的面积.

 .
.
(1)正态曲线:我们称
,,其中,时为参数,为正态密度函数,称它的图象为正态密度曲线,简称正态曲线.(2)正态分布:若随机变量X的概率分布密度函数为
,则称随机变量X服从正态分布,记为,时,称随机变量X服从(3)正态分布的期望与方差:若
,则 (4)正态曲线的特点:
①非负性:对
,,它的图象在x轴的上方.②定值性:曲线与x轴之间的面积为1.
③对称性:曲线是单峰的,它关于直线
④最大值:曲线在
处达到峰值.⑤当
无限增大时,曲线无限接近x轴.⑥当
一定时,曲线的位置由确定,曲线随着的变化而沿轴平移,如图①.⑦当
一定时,曲线的形状由确定,较小时曲线“瘦高”,表示随机变量X的分布比较集中;较大时,曲线“矮胖”,表示随机变量X的分布比较分散,如图②.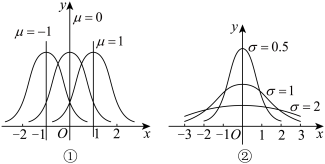
,如图所示,X取值不超过的概率为图中区域A的面积,而为区域B的面积.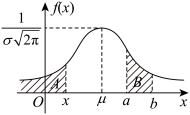
.
您最近一年使用:0次
23-24高二下·全国·课前预习
3 . 离散型随机变量的方差
如果离散型随机变量 的分布列如表所示,
则称
_____________ 为随机变量的方差,有时也记为 ,并称
,并称 为标准差,记为
__________ .
在方差计算中,利用结论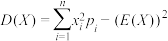 经常可以使计算简化.
如果离散型随机变量
的分布列如表所示,
|
|
| …… |
|
|
|
| …… |
|


 的方差,有时也记为,并称为标准差,记为
在方差计算中,利用结论
经常可以使计算简化.
您最近一年使用:0次
23-24高二下·全国·课前预习
4 . 下列问题属于排列问题的是( )
①从10个人中选2人分别去种树和扫地;
②从10个人中选2人去扫地;
③从班上30名男生中选出5人组成一个篮球队;
④从数字5,6,7,8中任取两个不同的数作幂运算.
①从10个人中选2人分别去种树和扫地;
②从10个人中选2人去扫地;
③从班上30名男生中选出5人组成一个篮球队;
④从数字5,6,7,8中任取两个不同的数作幂运算.
| A.①④ | B.①② | C.③④ | D.①③④ |
您最近一年使用:0次
23-24高二下·全国·课前预习
5 . 超几何分布的均值
若随机变量服从超几何分布,则
______ =__________ ( 是
是 件产品的次品率).
若随机变量
服从超几何分布,则是件产品的次品率).
您最近一年使用:0次
23-24高二下·全国·课前预习
6 . 超几何分布
一般地,假设一批产品共有件,其中有 件次品,从件产品中随机抽取
 件(不放回),用表示抽取的件产品中的次品数,则的分布列为
________ , .其中
.其中 ,
, ,
, ,
,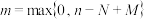 ,
, .如果随机变量的分布列具有上式的形式,那么称随机变量服从超几何分布.
一般地,假设一批产品共有
件,其中有件次品,从件产品中随机抽取件(不放回),用表示抽取的件产品中的次品数,则的分布列为.其中,,,,.如果随机变量的分布列具有上式的形式,那么称随机变量服从超几何分布.
您最近一年使用:0次
23-24高二下·全国·课前预习
7 . 一元线性回归模型
(1)一元线性回归模型
在研究两个变量线性相关时,我们常利用成对样本数据建立统计模型,并利用模型进行预测.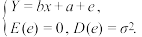 ①我们称①式为Y关于x的一元线性回归模型.
其中,Y称为因变量或________ ,x称为自变量或__________ ;
a和b为模型的未知参数,a称为______ 参数,b称为斜率参数;e是Y与bx+a之间的_______ .
如果e=0,那么Y与x之间的关系就可用一元线性函数模型来描述.
(2)一元线性回归模型参数的最小二乘估计
回归直线方程过样本点的中心_______ ,是回归直线方程最常用的一个特征.
(3)我们将 称为
称为 关于的线性回归方程,也称经验回归函数或经验回归公式,其图形称为经验回归直线.
这种求经验回归方程的方法叫做最小二乘法,求得的 叫做b,a的最小二乘估计,其中
(1)一元线性回归模型
在研究两个变量线性相关时,我们常利用成对样本数据建立统计模型,并利用模型进行预测.
①我们称①式为Y关于x的一元线性回归模型.其中,Y称为因变量或
a和b为模型的未知参数,a称为
如果e=0,那么Y与x之间的关系就可用一元线性函数模型来描述.
(2)一元线性回归模型参数的最小二乘估计
回归直线方程过样本点的中心
(3)我们将
称为关于的线性回归方程,也称经验回归函数或经验回归公式,其图形称为经验回归直线.这种求经验回归方程的方法叫做最小二乘法,求得的
叫做b,a的最小二乘估计,其中
您最近一年使用:0次
8 . 二项分布
(1)二项分布:一般地,在n重伯努利试验中,设每次试验中事件A发生的概率为 ,用X表示事件A发生的次数,则X的分布列为
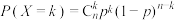 ,
, .如果随机变量X的分布列具有上式的形式,则称随机变量X服从二项分布,记作
______ ,且有______ ,
______ .
注:n次独立重复试验中恰好发生k次的概率与第k次才发生的概率计算公式分别是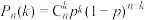 与
与 .
.
(2)确定一个二项分布模型的步骤
①明确伯努利试验及事件A的意义,确定事件A发生的概率p;
②确定重复试验的次数,并判断各次试验的独立性;
③设的次独立重复试验中事件 发生的次数,则
(1)二项分布:一般地,在n重伯努利试验中,设每次试验中事件A发生的概率为
,用X表示事件A发生的次数,则X的分布列为,.如果随机变量X的分布列具有上式的形式,则称随机变量X服从二项分布,记作注:n次独立重复试验中恰好发生k次的概率与第k次才发生的概率计算公式分别是
与.(2)确定一个二项分布模型的步骤
①明确伯努利试验及事件A的意义,确定事件A发生的概率p;
②确定重复试验的次数
,并判断各次试验的独立性;③设
的次独立重复试验中事件发生的次数,则
您最近一年使用:0次
23-24高二下·全国·课前预习
9 . n重伯努利试验
(1)伯努利试验:我们把只包含两个可能结果的试验叫做伯努利试验;
(2)定义:将一个伯努利实验独立地重复进行次所组成的随机试验称为n重伯努利实验;
(3)特征:(1)同一个伯努利实验重复做n次;(2)各次试验的结果______ .
(1)伯努利试验:我们把只包含两个可能结果的试验叫做伯努利试验;
(2)定义:将一个伯努利实验独立地重复进行
次所组成的随机试验称为n重伯努利实验;(3)特征:(1)同一个伯努利实验重复做n次;(2)各次试验的结果
您最近一年使用:0次
 列联表:一般地,假设两个分类变量
 ,其样本频数列联表(也称为


