名校
解题方法
1 . 工信部发布的《“十四五”促进中小企业发展规划》中明确提出建立“百十万千”的中小企业梯度培育体系,引导中小企业走向“专精特新”“小巨人”“隐形冠军”的发展方向,“专精特新”是指具备专业化、精细化、特色化、新颖化优势的中小企业.下表是某地2017-2021年新增企业数量的有关数据:
(1)求 和
和 的相关系数
的相关系数 (精确到0.01),并推断和的线性相关程度
 若
若 ,则线性相关程度很强;若
 ,则线性相关程度一般
 ;
;
(2)请根据表中所给的数据,求出关于的经验回归方程,并预测2025年此地新增企业的数量.
参考公式:相关系数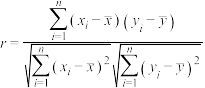 ,经验回归方程
 ,其中
,其中

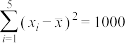
参考数据: .
.
| 年份(年) | 2017 | 2018 | 2019 | 2020 | 2021 |
年份代码 | 1 | 2 | 3 | 4 | 5 |
新增企业数量 | 8 | 17 | 29 | 24 | 42 |
和的相关系数(精确到0.01),并推断和的线性相关程度若,则线性相关程度很强;若,则线性相关程度一般;(2)请根据表中所给的数据,求出
关于的经验回归方程,并预测2025年此地新增企业的数量.参考公式:相关系数
,经验回归方程,其中参考数据:
.
您最近一年使用:0次
名校
解题方法
2 . 某高科技企业为确定下一年度投入某种产品的研发费用,需了解年研发费用(单位:千万元)对年销售量(单位:千万件)的影响,统计了近10年投入的年研发费用 与年销售量
与年销售量 的数据,经分析数据发现用函数
 (其中
(其中 均为大于0的常数)拟合效果较好,并对数据作出如下处理,得到相关统计量的值如下表所示:
其中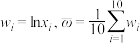 .根据数据预测投入的年研发费用为4.5亿元时的年销售量为( )(参考数据及公式:
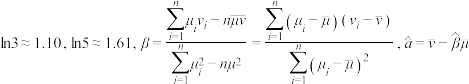 )
)
(单位:千万元)对年销售量(单位:千万件)的影响,统计了近10年投入的年研发费用与年销售量的数据,经分析数据发现用函数(其中均为大于0的常数)拟合效果较好,并对数据作出如下处理,得到相关统计量的值如下表所示: |  |  |  |  |  |  |
| 9.4 | 29.7 | 2 | 366 | 5.5 | 439.2 | 55 |
.根据数据预测投入的年研发费用为4.5亿元时的年销售量为( )(参考数据及公式:)| A.4.78亿件 | B.3.68亿件 | C.47.8亿件 | D.36.8亿件 |
您最近一年使用:0次
名校
解题方法
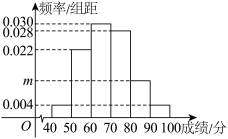
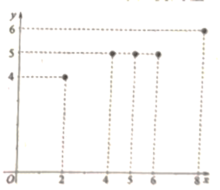
3 . 某高科技公司组织大型招聘会,全部应聘人员的笔试成绩统计如图所示:
(2)该公司2020—2024年每年招聘的新员工人数逐年增加,且这五年招聘的新员工总人数为500,若用这五年的数据求出每年招聘的新员工人数y关于年份代码x(x=年份-2019)的线性回归方程为 ,请根据此回归模型预测该公司2026年招聘的新员工人数是否会超过250.
(2)该公司2020—2024年每年招聘的新员工人数逐年增加,且这五年招聘的新员工总人数为500,若用这五年的数据求出每年招聘的新员工人数y关于年份代码x(x=年份-2019)的线性回归方程为
,请根据此回归模型预测该公司2026年招聘的新员工人数是否会超过250.
您最近一年使用:0次
名校
解题方法
4 . 某班级有60名同学参加了某次考试,从中随机抽选出5名同学,他们的数学成绩与物理成绩如下表:
数据表明与之间有较强的线性相关性.
(1)利用表中数据,求关于的经验回归方程,并预测该班某同学的数学成绩为90分时的物理成绩;
(2)在本次考试中,规定数学成绩达到125分为数学优秀,物理成绩达到100分为物理优秀. 若该班的数学优秀率与物理优秀率分别为 和
和 ,且所有同学中数学优秀但物理不优秀的同学共有6人,请你完成下面的
 列联表,依据小概率值
 的独立性检验,能否认为数学成绩与物理成绩有关联?
参考公式及数据: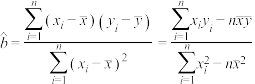 ,
, ,
, ,
, ,
,
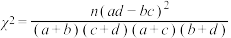 ,其中
,其中 .
.
下表是 独立性检验中几个常用的小概率值和相应的临界值.
与物理成绩如下表:数学成绩 | 140 | 130 | 120 | 110 | 100 |
物理成绩 | 110 | 90 | 100 | 80 | 70 |
与之间有较强的线性相关性.(1)利用表中数据,求
关于的经验回归方程,并预测该班某同学的数学成绩为90分时的物理成绩;(2)在本次考试中,规定数学成绩达到125分为数学优秀,物理成绩达到100分为物理优秀. 若该班的数学优秀率与物理优秀率分别为
和,且所有同学中数学优秀但物理不优秀的同学共有6人,请你完成下面的列联表,依据小概率值的独立性检验,能否认为数学成绩与物理成绩有关联?数学成绩 | 物理成绩 | 合计 | |
物理优秀 | 物理不优秀 | ||
数学优秀 | |||
数学不优秀 | |||
合计 | |||
,,,,,其中.下表是
独立性检验中几个常用的小概率值和相应的临界值.
| 0.1 | 0.05 | 0.01 | 0.005 | 0.001 |
| 2.706 | 3.841 | 6.635 | 7.879 | 10.828 |


您最近一年使用:0次
名校
解题方法
5 . 2024年2月10日至17日(正月初一至初八),“2024•内江市中区新春极光焰火草地狂欢节”在川南大草原举行,共举行了8场精彩的烟花秀节目.前5场的观众人数(单位:万人)与场次的统计数据如表所示:
(1)已知可用线性回归模型拟合与的关系,请建立关于的线性回归方程;
(2)若该烟花秀节目分A、B、C三个等次的票价,某机构随机调查了该烟花秀节目现场200位观众的性别与购票情况,得到的部分数据如表所示,请将列联表补充完整,并判断能否有 的把握认为该烟花秀节目的观众是否购买A等票与性别有关.
参考公式及参考数据:回归方程 中斜率与截距的最小二乘法估计公式分别为
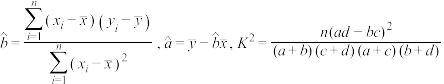 ,其中.
,其中.
场次编号 | 1 | 2 | 3 | 4 | 5 |
观众人数 | 0.7 | 0.8 | 1 | 1.2 | 1.3 |
与的关系,请建立关于的线性回归方程;(2)若该烟花秀节目分A、B、C三个等次的票价,某机构随机调查了该烟花秀节目现场200位观众的性别与购票情况,得到的部分数据如表所示,请将
列联表补充完整,并判断能否有的把握认为该烟花秀节目的观众是否购买A等票与性别有关.购买A等票 | 购买非A等票 | 总计 | |
男性观众 | 50 | ||
女性观众 | 60 | ||
总计 | 100 | 200 |
中斜率与截距的最小二乘法估计公式分别为,其中.
| 0.100 | 0.050 | 0.010 |
| 2.706 | 3.841 | 6.635 |


您最近一年使用:0次
7日内更新
|
1066次组卷
|
4卷引用:四川省内江市2024届高三第三次模拟考试数学理科试题
解题方法
6 . 假期中,来自沿海城市的小明和小强去四川旅游,他们发现自己带的小面包的包装袋鼓了起来.原来随着海拔升高,气压也随之降低,包装袋内的气压大于外面气压,从而使得面包袋鼓了起来.研究发现在一定范围内大气压与海拔高度是近似线性的关系.
(1)利用线性回归分析求与之间的线性回归方程;( 的值精确到0.001)
(2)小明和小强打算去九寨沟,可以利用(1)中的方程,估计九寨沟A景点(海拔2800m)的大气压.(精确到0.01)
附:①对于一组数据 ,
, ,…,
,…, ,其回归直线
 的斜率和截距的最小二乘估计分别为:
 ,
, .
.
②参考数据: ,
, .
.
海拔高度 | 10 | 50 | 100 | 500 | 1000 |
大气压 | 101.2 | 100.6 | 100.2 | 94.8 | 88.2 |
与之间的线性回归方程;(的值精确到0.001)(2)小明和小强打算去九寨沟,可以利用(1)中的方程,估计九寨沟A景点(海拔2800m)的大气压.(精确到0.01)
附:①对于一组数据
,,…,,其回归直线的斜率和截距的最小二乘估计分别为:,.②参考数据:
,.
您最近一年使用:0次
名校
7 . 从非洲蔓延到东南亚的蝗虫灾害严重威胁了国际农业生产,影响了人民生活.世界性与区域性温度的异常、旱涝频繁发生给蝗灾发生创造了机会.已知蝗虫的产卵量与温度的关系可以用模型 (其中
(其中 为自然对数的底数)拟合,设
 ,其变换后得到一组数据:
由上表可得经验回归方程 ,则当
,则当 时,蝗虫的产卵量的估计值为
__________ .
与温度的关系可以用模型(其中为自然对数的底数)拟合,设,其变换后得到一组数据:x | 20 | 23 | 25 | 27 | 30 |
z | 2 | 2.4 | 3 | 3 | 4.6 |
,则当时,蝗虫的产卵量的估计值为
您最近一年使用:0次
解题方法
8 . 为了适应市场需求,同时兼顾企业盈利的预期,某科技公司决定增加一定数量的研发人员,经过调研,得到年收益增量(单位:亿元)与研发人员增量(人)的10组数据.现用模型① ,②
,② 分别进行拟合,由此得到相应的经验回归方程,并进行残差分析,得到如图所示的残差图.
 .
.
(1)根据残差图,判断应选择哪个模型;(无需说明理由)
(2)根据(1)中所选模型,求出关于的经验回归方程;并用该模型预测,要使年收益增量超过8亿元,研发人员增量至少多少人?(精确到1)
(单位:亿元)与研发人员增量(人)的10组数据.现用模型①,②分别进行拟合,由此得到相应的经验回归方程,并进行残差分析,得到如图所示的残差图.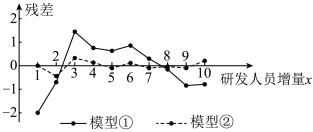
. |  |  |  |  |  |
| 7.5 | 2.25 | 82.50 | 4.50 | 12.14 | 2.88 |
(1)根据残差图,判断应选择哪个模型;(无需说明理由)
(2)根据(1)中所选模型,求出
关于的经验回归方程;并用该模型预测,要使年收益增量超过8亿元,研发人员增量至少多少人?(精确到1)
您最近一年使用:0次
名校
解题方法
9 . 航天行业拥有广阔的发展前景,有越来越多的公司开始从事航天研究.某航天公司研发了一种火箭推进器,为测试其性能,对推进器飞行距离与损坏零件数进行了统计,数据如下:
参考数据: ,
, ,
, ,
,
(1)建立y关于x的回归模型,根据所给数据及回归模型,求 ;(精确到0.1)
(2)该公司进行了第二项测试,从所有同型号推进器中随机抽取100台进行等距离飞行测试,对其中60台进行飞行前保养,测试结束后,100台推进器中有20台报废,其中保养过的推进器占比35%.请根据统计数据完成2×2列联表,并根据小概率值 的独立性检验,能否认为推进器报废与保养有关?
附:回归方程中斜率和截距的最小二乘估计公式分别为 ,,;
,,;
飞行距离x(千公里) | 54 | 62 | 69 | 78 | 88 | 100 | 109 |
损坏零件数y(个) | 61 | 73 | 88 | 100 | 118 | 142 | 160 |
,,,(1)建立y关于x的回归模型
,根据所给数据及回归模型,求;(精确到0.1)(2)该公司进行了第二项测试,从所有同型号推进器中随机抽取100台进行等距离飞行测试,对其中60台进行飞行前保养,测试结束后,100台推进器中有20台报废,其中保养过的推进器占比35%.请根据统计数据完成2×2列联表,并根据小概率值
的独立性检验,能否认为推进器报废与保养有关?保养 | 未保养 | 合计 | |
报废 | 20 | ||
未报废 | |||
合计 | 60 | 100 |
中斜率和截距的最小二乘估计公式分别为,,;
| 0.10 | 0.05 | 0.01 | 0.005 | 0.001 |
| 2.706 | 3.841 | 6.635 | 7.879 | 10.828 |

您最近一年使用:0次
名校
解题方法
10 . 桹据统计得到某蔬菜基地茄子亩产量的增加量y(千克)与某种液体肥料每亩使用量x(千克)之间的对应数据的散点图,如图所示. ,则线性相关程度很高,可用线性回归模型拟合)
(2)求y关于x的回归方程,并预测液体肥料每亩使用量为10千克时,茄子亩产量的增加量y约为多少?
附:相关系数公式,参考数据: ,回归方程
,回归方程 中斜率的最小二乘估计公式为:
 .
.
,则线性相关程度很高,可用线性回归模型拟合)(2)求y关于x的回归方程,并预测液体肥料每亩使用量为10千克时,茄子亩产量的增加量y约为多少?
附:相关系数公式
,参考数据:,回归方程中斜率的最小二乘估计公式为:.
您最近一年使用:0次


