23-24高二下·上海·期末
解题方法
1 . 党的十九大提出实施乡村振兴战略以来,农民收入大幅提升,2022年9月23日某市举办中国农民丰收节庆祝活动,粮食总产量有望连续十年全省第一.据统计该市2017年至2021年农村居民人均可支配收入 (单位:万元)与年份代码
 (见下表)具有线性相关关系,计算得
 ,
, ,
, .
.
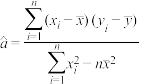
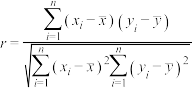
(1)根据上表数据,计算与的相关系数 ,并判断与是否具有较高的线性相关程度(若
 ,则线性相关程度一般,若
 ,则线性相关程度较高,精确到
 ;
;
(2)求出关于的线性回归方程.
参考公式:
相关系数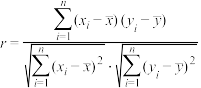 ,
, ,
, .
.
(单位:万元)与年份代码(见下表)具有线性相关关系,计算得,,.| 年份 | 2017 | 2018 | 2019 | 2020 | 2021 |
| 年份代码 | 1 | 2 | 3 | 4 | 5 |
与的相关系数,并判断与是否具有较高的线性相关程度(若,则线性相关程度一般,若,则线性相关程度较高,精确到;(2)求出
关于的线性回归方程.参考公式:
相关系数
,,.
您最近一年使用:0次
名校
解题方法
2 . 2024年初,冰城哈尔滨充分利用得天独厚的冰雪资源,成为2024年第一个“火出圈”的网红城市,冰城通过创新营销展示了丰富的文化活动,成功提升了吸引力和知名度,为其他旅游城市提供了宝贵经验,从2024年1月1日至5日,哈尔滨太平国际机场接待外地游客数量如下:
(1)计算 的相关系数(计算结果精确到0.01),并判断是否可以认为日期与游客人数的相关性很强;
(2)请根据上表提供的数据,用最小二乘法求出关于的线性回归方程;
(3)为了吸引游客,在冰雪大世界售票处针对各个旅游团进行了现场抽奖的活动,具体抽奖规则为:从该旅游团中随机同时抽取两名游客,两名游客性别不同则为中奖.已知某个旅游团中有5个男游客和 个女游客,设重复进行三次抽奖中恰有一次中奖的概率为
 ,当
,当 取多少时,最大?
参考公式: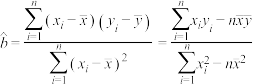 ,
, ,
, ,
,
参考数据: .
.
| (日) | 1 | 2 | 3 | 4 | 5 |
| (万人) | 45 | 50 | 60 | 65 | 80 |
的相关系数(计算结果精确到0.01),并判断是否可以认为日期与游客人数的相关性很强;(2)请根据上表提供的数据,用最小二乘法求出
关于的线性回归方程;(3)为了吸引游客,在冰雪大世界售票处针对各个旅游团进行了现场抽奖的活动,具体抽奖规则为:从该旅游团中随机同时抽取两名游客,两名游客性别不同则为中奖.已知某个旅游团中有5个男游客和
个女游客,设重复进行三次抽奖中恰有一次中奖的概率为,当取多少时,最大?参考公式:
,,,参考数据:
.
您最近一年使用:0次
7日内更新
|
1430次组卷
|
3卷引用:甘肃省天水市第一中学2023-2024学年高二下学期第二学段检测考试(6月)数学试题
甘肃省天水市第一中学2023-2024学年高二下学期第二学段检测考试(6月)数学试题(已下线)高二数学下学期期末模拟--高二期末考点大串讲(苏教版2019选择性必修第二册)黑龙江省哈尔滨市第六中学校2024届(2021级)高三下学期四模数学试题
名校
解题方法
3 . 数据显示,某企业近年加大了科技研发资金的投入,其科技投入(百万元)与收益(百万元)的数据统计如下:
根据数据特点,甲认为样本点分布在指数型曲线 的周围,据此他对数据进行了一些初步处理.如下表:
其中 ,
, .
.
(1)请根据表中数据,建立关于的回归方程(系数 精确到0.1);
(2)①乙认为样本点分布在直线 的周围,并计算得线性回归方程为
 ,以及该回归模型的决定系数
 ,试比较甲、乙两人所建立的模型,谁的拟合效果更好?
②由①所得的结论,计算该企业欲使收益达到1亿元,科技投入的费用至少要多少百万元?(精确到0.1)
附:对于一组数据 ,
, ,……,
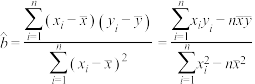
,……, ,其线性回归直线
 的斜率和截距的最小二乘法估计公式分别为
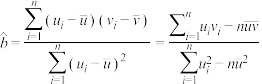 ,
, ,决定系数:
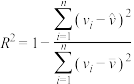 .参考数据:
 .
.
(百万元)与收益(百万元)的数据统计如下:科技投入 | 1 | 2 | 3 | 4 | 5 | 6 | 7 |
收益 | 19 | 20 | 22 | 31 | 40 | 50 | 70 |
的周围,据此他对数据进行了一些初步处理.如下表:
|
|
|
|
|
|
5 | 140 | 1239 | 149 | 2134 | 130 |


 ,.
,.(1)请根据表中数据,建立
关于的回归方程(系数精确到0.1);(2)①乙认为样本点分布在直线
的周围,并计算得线性回归方程为,以及该回归模型的决定系数,试比较甲、乙两人所建立的模型,谁的拟合效果更好?②由①所得的结论,计算该企业欲使收益达到1亿元,科技投入的费用至少要多少百万元?(精确到0.1)
附:对于一组数据
,,……,,其线性回归直线的斜率和截距的最小二乘法估计公式分别为,,决定系数:.参考数据:.
您最近一年使用:0次
名校
解题方法
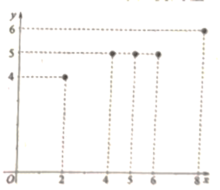
4 . 桹据统计得到某蔬菜基地茄子亩产量的增加量y(千克)与某种液体肥料每亩使用量x(千克)之间的对应数据的散点图,如图所示. ,则线性相关程度很高,可用线性回归模型拟合)
(2)求y关于x的回归方程,并预测液体肥料每亩使用量为10千克时,茄子亩产量的增加量y约为多少?
附:相关系数公式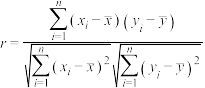 ,参考数据:
 ,回归方程
,回归方程 中斜率的最小二乘估计公式为:
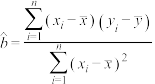 .
.
,则线性相关程度很高,可用线性回归模型拟合)(2)求y关于x的回归方程,并预测液体肥料每亩使用量为10千克时,茄子亩产量的增加量y约为多少?
附:相关系数公式
,参考数据:,回归方程中斜率的最小二乘估计公式为:.
您最近一年使用:0次
名校
解题方法
5 . 广东省深圳市是全国七大电动车生产基地之一,拥有完整的产业链和突出的设计优势.某电动车公司为了抢占更多的市场份额,计划加大广告投入.该公司近5年的年广告费 (单位:百万元)和年销售量
 (单位:百万辆)关系如图所示:
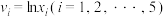 ,数据经过初步处理得:
现有① 和②
和② 两种方案作为年销售量关于年广告费的回归分析模型,其中
 ,
, ,
, ,
, 均为常数.
均为常数.
(1)请从相关系数的角度,分析哪一个模型拟合程度更好?(不能整除的相关系数保留2位小数)
(2)根据(1)的分析选取拟合程度更好的回归分析模型及表中数据,求出关于的回归方程,并预测年广告费为6(百万元)时,产品的年销售量是多少?
附:①相关系数 ,回归直线
,回归直线 中公式分别为
 ,,
,,
②参考数据: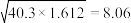 ,
, ,
, ,
, .
.
(单位:百万元)和年销售量(单位:百万辆)关系如图所示: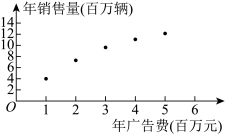
,数据经过初步处理得:
|
|
|
|
|
|
|
44 | 4.8 | 10 | 40.3 | 1.612 | 19.5 | 8.06 |


 和②两种方案作为年销售量关于年广告费的回归分析模型,其中,,,均为常数.
(1)请从相关系数的角度,分析哪一个模型拟合程度更好?(不能整除的相关系数保留2位小数)
(2)根据(1)的分析选取拟合程度更好的回归分析模型及表中数据,求出
关于的回归方程,并预测年广告费为6(百万元)时,产品的年销售量是多少?附:①相关系数
,回归直线中公式分别为,,②参考数据:
,,,.
您最近一年使用:0次
解题方法
6 . 为了适应市场需求,同时兼顾企业盈利的预期,某科技公司决定增加一定数量的研发人员,经过调研,得到年收益增量(单位:亿元)与研发人员增量(人)的10组数据.现用模型①,② 分别进行拟合,由此得到相应的经验回归方程,并进行残差分析,得到如图所示的残差图.
 .
.
(1)根据残差图,判断应选择哪个模型;(无需说明理由)
(2)根据(1)中所选模型,求出关于的经验回归方程;并用该模型预测,要使年收益增量超过8亿元,研发人员增量至少多少人?(精确到1)
(单位:亿元)与研发人员增量(人)的10组数据.现用模型①,②分别进行拟合,由此得到相应的经验回归方程,并进行残差分析,得到如图所示的残差图.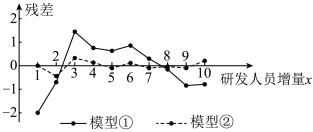
. |  |  |  |  |  |
| 7.5 | 2.25 | 82.50 | 4.50 | 12.14 | 2.88 |
(1)根据残差图,判断应选择哪个模型;(无需说明理由)
(2)根据(1)中所选模型,求出
关于的经验回归方程;并用该模型预测,要使年收益增量超过8亿元,研发人员增量至少多少人?(精确到1)
您最近一年使用:0次
解题方法
7 . 当今社会面临职业选择时,越来越多的青年人选择通过创业、创新的方式实现人生价值.小明是一名刚毕业的大学生,通过直播带货的方式售卖自己家乡的特产,下面是他近5个月的家乡特产收入y(单位:万元)的情况,如表所示.
(1)根据5月至9月的数据,求y与t之间的样本相关系数(精确到0.001),并判断相关性;
(2)求出y关于t的经验回归方程(结果中 保留两位小数),并预测10月收入能否突破1.5万元,请说明理由.
附:样本相关系数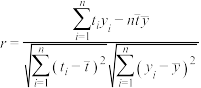 .一组数据
.一组数据 其经验回归方程的斜率和截距的最小二乘估计公式分别为
 ,
, .
. ,
, ,
, ,
, .
.
| 月份 | 5 | 6 | 7 | 8 | 9 |
| 时间代号t | 1 | 2 | 3 | 4 | 5 |
| 家乡特产收入y | 3 | 2.4 | 2.2 | 2 | 1.8 |
(2)求出y关于t的经验回归方程(结果中
保留两位小数),并预测10月收入能否突破1.5万元,请说明理由.附:样本相关系数
.一组数据其经验回归方程的斜率和截距的最小二乘估计公式分别为,.,,,.
您最近一年使用:0次
2024高二下·江苏·专题练习
解题方法
8 . 为帮助乡村脱贫,某勘探队计划了解当地矿脉某金属的分布情况,测得了平均金属含量(单位: )与样本对原点的距离(单位:m)的数据,并作了初步处理,得到了下面的一些统计理的值.(表中
 ,
, )
)
(1)利用样本相关系数的知识,判断 与
与 哪一个更适宜作为平均金属含量关于样本对原点的距离的回归方程类型?
(2)根据(1)的结果回答下列问题:
①建立关于的回归方程;
②样本对原点的距离 时,金属含量的预报值是多少?
附:对于一组数据 ,其线性相关系数
 ,其回归直线
 的斜率和截距的最小二乘估计分别为:
 ,
, .
.
(单位:)与样本对原点的距离(单位:m)的数据,并作了初步处理,得到了下面的一些统计理的值.(表中,) | |  |  |  |  |  |  |
| 6 | 97.90 | 0.21 | 60 | 0.14 | 14.12 | 26.13 |  |
与哪一个更适宜作为平均金属含量关于样本对原点的距离的回归方程类型?(2)根据(1)的结果回答下列问题:
①建立
关于的回归方程;②样本对原点的距离
时,金属含量的预报值是多少?附:对于一组数据
,其线性相关系数,其回归直线的斜率和截距的最小二乘估计分别为:,.
您最近一年使用:0次
名校
9 . 某公司为了解年研发资金(单位:亿元)对年产值(单位:亿元)的影响,对公司近8年的年研发资金和年产值( ,
, )的数据对比分析中,选用了两个回归模型,并利用最小二乘法求得相应的关于的经验回归方程:
① ;②
;② .
.
(1)求 的值;
的值;
(2)已知①中的残差平方和 ,②中的残差平方和
 ,请根据决定系数选择拟合效果更好的经验回归方程,并利用该经验回归方程预测年研发资金为20亿元时的年产值.
参考数据: ,
, ,
, ,
, .
.
参考公式;刻画回归模型拟合效果的决定系数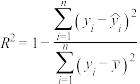 .
.
(单位:亿元)对年产值(单位:亿元)的影响,对公司近8年的年研发资金和年产值(,)的数据对比分析中,选用了两个回归模型,并利用最小二乘法求得相应的关于的经验回归方程:①
;②.(1)求
的值;(2)已知①中的残差平方和
,②中的残差平方和,请根据决定系数选择拟合效果更好的经验回归方程,并利用该经验回归方程预测年研发资金为20亿元时的年产值.参考数据:
,,,.参考公式;刻画回归模型拟合效果的决定系数
.
您最近一年使用:0次
名校
解题方法
10 . 下表是2017-2021年五年《中国生态环境状况公报》中酸雨区面积约占国土面积的百分比( ):
):
(1)求2017—2021年年份代码与的样本相关系数(精确到0.01);
(2)请用样本相关系数说明该组数据中y与x之间的关系可用一元线性回归模型进行描述,并求出y关于x的经验回归方程;
(3)预测2024年的酸雨区面积占国土面积的百分比.
附:样本相关系数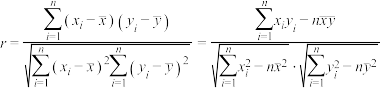 ,回归直线
,回归直线 ,
, .数据:
.数据: ,
, ,
, .
.
):| 年份 | 2017 | 2018 | 2019 | 2020 | 2021 |
| 年份代码 | 1 | 2 | 3 | 4 | 5 |
| 6.4 | 5.5 | 5.0 | 4.8 | 3.8 |
与的样本相关系数(精确到0.01);(2)请用样本相关系数说明该组数据中y与x之间的关系可用一元线性回归模型进行描述,并求出y关于x的经验回归方程;
(3)预测2024年的酸雨区面积占国土面积的百分比.
附:样本相关系数
,回归直线,.数据:,,.
您最近一年使用:0次


