一台机器按不同的转速生产出来的某机械零件有一些会有缺点,每小时生产有缺点零件的多少,随机器的运转的速度而变化,具有线性相关关系,下表为抽样试验的结果:
(1)如果 对
对 有线性相关关系,求回归方程;
(2)若实际生产中,允许每小时生产的产品中有缺点的零件最多有1个,那么机器的运转速度应控制在什么范围内?参考公式: ,
,
 .
.
转速 | 8 | 10 | 12 | 14 | 16 |
每小时生产有缺点的零件数 | 5 | 7 | 8 | 9 | 11 |
对有线性相关关系,求回归方程;(2)若实际生产中,允许每小时生产的产品中有缺点的零件最多有1个,那么机器的运转速度应控制在什么范围内?参考公式:
,.
更新时间:2019-04-12 21:39:57
|
相似题推荐
解答题-问答题
|
适中
(0.65)
名校
解题方法
【推荐1】某校医务室欲研究昼夜温差大小与高三患感冒人数多少之间的关系,他们统计了2019年9月至2020年1月每月8号的昼夜温差情况与高三因患感冒而就诊的人数,得到如下资料:
该医务室确定的研究方案是先从这5组数据中选取2组,用剩下的3组数据求线性回归方程,再用被选取的2组数据进行检验.假设被选取的是2019年9月8日与2020年1月8日的2组数据.
(1)求就诊人数关于昼夜温差x的线性回归方程 (结果精确到0.01)
(2)若由(1)中所求的线性回归方程得到的估计数据与所选出的检验数据的误差均不超过3人,则认为得到的线性回归方程是理想的,试问该医务室所得线性回归方程是否理想?
参考公式:
| 日期 | 2019年9月8日 | 2019年10月8日 | 2019年11月8日 | 2019年12月8日 | 2020年1月8日 |
昼夜温差 | 5 | 8 | 12 | 13 | 16 |
| 就诊人数 | 10 | 16 | 26 | 30 | 35 |
(1)求就诊人数
关于昼夜温差x的线性回归方程(结果精确到0.01)(2)若由(1)中所求的线性回归方程得到的估计数据与所选出的检验数据的误差均不超过3人,则认为得到的线性回归方程是理想的,试问该医务室所得线性回归方程是否理想?
参考公式:
您最近一年使用:0次
解答题-应用题
|
适中
(0.65)
【推荐2】宝宝的健康成长是妈妈们最关心的问题,父母亲为婴儿选择什么品牌的奶粉一直以来都是育婴中的一个重要话题,为了解过程奶粉的知名度和消费者的信任度,某调查小组特别调查记录了某大型连锁超市2015年与2016年这两年销售量前5名的五个品牌奶粉的销量(单位:罐),绘制如下的管状图:
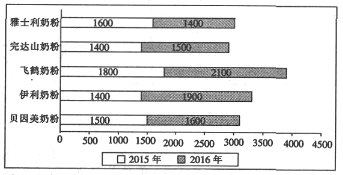
(1)根据给出的这两年销量的管状图,对该超市这两年品牌奶粉销量的前五强进行排名;
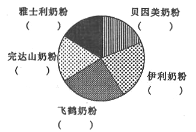
(2)分别计算这5个品牌奶粉2016年所占总销量(仅指这5个品牌奶粉的总销量)的百分比(百分数精确到各位),并将数据填入如下饼状图中的括号内;
(3)已知该超市2014年飞鹤奶粉的销量为 (单位:罐),试以
 这3年的销量得出销量关于年份的线性回归方程,并据此预测2017年该超市飞鹤奶粉的销量.
相关公式: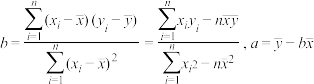
(1)根据给出的这两年销量的管状图,对该超市这两年品牌奶粉销量的前五强进行排名;
(2)分别计算这5个品牌奶粉2016年所占总销量(仅指这5个品牌奶粉的总销量)的百分比(百分数精确到各位),并将数据填入如下饼状图中的括号内;
(3)已知该超市2014年飞鹤奶粉的销量为
(单位:罐),试以这3年的销量得出销量关于年份的线性回归方程,并据此预测2017年该超市飞鹤奶粉的销量.相关公式:
您最近一年使用:0次
 ,并估计今年6月份该种产品的产量.
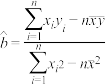 ,
, .
.
解答题-应用题
|
适中
(0.65)
解题方法
【推荐1】某工厂为了对新研发的一种产品进行合理定价,将该产品按事先拟定的价格进行试销,得到如下数据:
(1)求回归直线方程 ,并预测当单价为10元时的销量;
(2)预计在今后的销售中,销量与单价仍然服从(1)中的关系,且该产品的成本是5元/件,该产品的单价应定为多少元时,可使工厂获得最大利润?(利润=销售收入-成本)
附:参考公式: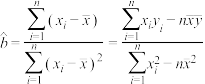 ,
, ,
, ,
, .
.
单价 | 8 | 8.2 | 8.4 | 8.6 | 8.8 | 9 |
销量 | 90 | 84 | 83 | 80 | 75 | 68 |
,并预测当单价为10元时的销量;(2)预计在今后的销售中,销量与单价仍然服从(1)中的关系,且该产品的成本是5元/件,该产品的单价应定为多少元时,可使工厂获得最大利润?(利润=销售收入-成本)
附:参考公式:
,,,.
您最近一年使用:0次
解答题-问答题
|
适中
(0.65)
名校
解题方法
【推荐2】为帮助乡材脱贫,某勘探队计划了解当地矿脉某金属的分布情况,经勘测得到该金属含量(单位: )与样本对原点的距离(单位:
 )的数据,并作了初步处理,得到下面的一些统计量的值.(表中
 )
)
(1)利用样本相关系数的知识,判断 与
与 哪一个更适宜作为该金属含量关于样本对原点的距离的回归方程类型?
(2)根据(1)的结果解决下列问题:
(i)建立关于的回归方程;
(ii)样本对原点的距离 时,该金属含量的预报值是多少?
(3)已知该金属在距离原点 时的平均开采成本
 (单位:元)与
 的关系为
的关系为 ,根据(2)的结论说明,为何值时,开采成本最大?
附:线性回归方程 的斜率和截距的最小二乘法公式分别为
 .
.
(单位:)与样本对原点的距离(单位:)的数据,并作了初步处理,得到下面的一些统计量的值.(表中) |  |  |  |  |  |  |  |
| 6 | 97.90 | 0.21 | 60 | 0.14 | 14.12 | 26.13 | -1.40 |
与哪一个更适宜作为该金属含量关于样本对原点的距离的回归方程类型?(2)根据(1)的结果解决下列问题:
(i)建立
关于的回归方程;(ii)样本对原点的距离
时,该金属含量的预报值是多少?(3)已知该金属在距离原点
时的平均开采成本(单位:元)与的关系为,根据(2)的结论说明,为何值时,开采成本最大?附:线性回归方程
的斜率和截距的最小二乘法公式分别为.
您最近一年使用:0次
解答题-问答题
|
适中
(0.65)
名校
【推荐3】统计中用相关系数 来衡量两个变量之间的线性相关的强弱,若相应于变量的取值
 ,变量的观测值
 ,则两个变量的相关关系的计算公式为
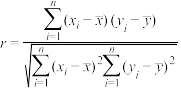 .
.
对于变量 ,若
,若 ,
, 时,那么负相关很强;若
 ,
, 时,那么正相关很强;若
 ,
, 或
或 ,
, ,那么相关性一般;若
 ,
, ,那么相关性较弱.下表是一位母亲给儿子作的成长记录:
(1)根据公式以及上表数据,判断孩子在3岁到7岁期间年龄与身高线性相关的强弱;
(2)根据上表数据,,求出年龄与身高的线性回归方程,并根据求得的回归方程,预估孩子8岁时的身高.
 ,
, .
.
来衡量两个变量之间的线性相关的强弱,若相应于变量的取值,变量的观测值,则两个变量的相关关系的计算公式为.对于变量
,若,时,那么负相关很强;若,时,那么正相关很强;若,或,,那么相关性一般;若,,那么相关性较弱.下表是一位母亲给儿子作的成长记录:年龄/周岁 | 3 | 4 | 5 | 6 | 7 |
身高/厘米 | 91 | 98 | 104 | 111 | 116 |
(2)根据上表数据,,求出年龄与身高的线性回归方程
,并根据求得的回归方程,预估孩子8岁时的身高.,.
您最近一年使用:0次


