23-24高二下·江苏·课前预习
1 . 判断以下两个变量之间是否具有相关关系?
(1)正方形的面积与其周长之间的关系;
(2)父母的身高与子女的身高之间的关系;
(3)学生的学号与身高;
(4)汽车匀速行驶时的路程与时间的关系.
(1)正方形的面积与其周长之间的关系;
(2)父母的身高与子女的身高之间的关系;
(3)学生的学号与身高;
(4)汽车匀速行驶时的路程与时间的关系.
您最近一年使用:0次
23-24高二下·江苏·课前预习
解题方法
2 . 某车间为了规定工时定额,需要确定加工零件所花费的时间,为此做了四次实验,得到的数据如下:
(1)已知零件个数与加工时间线性相关,求出 关于
关于 的线性回归方程;
(2)试预测加工 个零件需要多少时间?
参考公式: ,
, .
.
零件的个数 |
|
|
|
|
加工的时间 |
|
|
|
|


 关于的线性回归方程;
(2)试预测加工
个零件需要多少时间?参考公式:
,.
您最近一年使用:0次
3 . 大气污染物 (直径不大于2.5
 的颗粒物)的浓度超过一定限度会影响人的身体健康.为研究浓度y(单位:
 )与汽车流量x(单位:千辆)的线性关系,研究人员选定了10个城市,在每个城市建立交通监测点,统计了24h内过往的汽车流量以及同时段空气中的浓度,得到如下数据:
并计算得 ,
, ,
,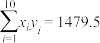 .
.
(1)求变量关于的线性回归方程;
(2)根据 内浓度确定空气质量等级,浓度在0~35为优,35~75为良,75~115为轻度污染,115~150为中度污染,150~250为重度污染,已知某城市内过往的汽车流量为1360辆,判断该城市的空气质量等级.
参考公式:线性回归方程为 ,其中以
,其中以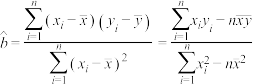 .
.
(直径不大于2.5的颗粒物)的浓度超过一定限度会影响人的身体健康.为研究浓度y(单位:)与汽车流量x(单位:千辆)的线性关系,研究人员选定了10个城市,在每个城市建立交通监测点,统计了24h内过往的汽车流量以及同时段空气中的浓度,得到如下数据:城市编号 | 1 | 2 | 3 | 4 | 5 | 6 | 7 | 8 | 9 | 10 | 总和 |
x | 1.300 | 1.444 | 0.786 | 1.652 | 1.756 | 1.754 | 1.200 | 1.500 | 1.200 | 0.908 | 13.5 |
y | 66 | 76 | 21 | 170 | 156 | 120 | 72 | 120 | 100 | 129 | 1030 |
,,.(1)求变量
关于的线性回归方程;(2)根据
内浓度确定空气质量等级,浓度在0~35为优,35~75为良,75~115为轻度污染,115~150为中度污染,150~250为重度污染,已知某城市内过往的汽车流量为1360辆,判断该城市的空气质量等级.参考公式:线性回归方程为
,其中以.
您最近一年使用:0次
2024高三上·全国·专题练习
解题方法
4 . 某校数学建模学生社团进行了一项实验研究,采集了 的一组数据如下表所示:
该社团对上述数据进行了分析,发现与之间具有线性相关关系.
(1)画出表中数据的散点图,并指出与之间的相关系数 是正还是负;
(2)求出关于的线性回归方程,并写出当 时,预测数据的值.
附:在线性回归方程 中,
中,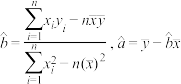 ,其中
,其中 为样本平均值.
的一组数据如下表所示:
| 2 | 3 | 4 | 5 | 6 | 7 |
| 52.5 | 45 | 40 | 30 | 25 | 17.5 |
与之间具有线性相关关系.(1)画出表中数据的散点图,并指出
与之间的相关系数是正还是负;(2)求出
关于的线性回归方程,并写出当时,预测数据的值.附:在线性回归方程
中,,其中为样本平均值.
您最近一年使用:0次
解题方法
5 . 《中华人民共和国道路交通安全法》第 条的相关规定:机动车行经人行横道时,应当减速慢行;遇行人正在通过人行横道,应当停车让行,俗称“礼让斑马线”,其中第
 条规定:对不礼让行人的驾驶员处以扣
 分,罚款
分,罚款 元的处罚.下表是某市一主干路口监控设备所抓拍的
 个月内驾驶员不“礼让斑马线”行为统计数据:
参考公式: ,
,
(1)请利用所给数据求违章人数与月份之间的回归直线方程 ;
;
(2)预测该路口 月份的不“礼让斑马线”违章驾驶员人数.
条的相关规定:机动车行经人行横道时,应当减速慢行;遇行人正在通过人行横道,应当停车让行,俗称“礼让斑马线”,其中第条规定:对不礼让行人的驾驶员处以扣分,罚款元的处罚.下表是某市一主干路口监控设备所抓拍的个月内驾驶员不“礼让斑马线”行为统计数据:月份 |
|
|
|
|
|
违章驾驶员人数 |
|
|
|
|
|


 ,
,(1)请利用所给数据求违章人数
与月份之间的回归直线方程;(2)预测该路口
月份的不“礼让斑马线”违章驾驶员人数.
您最近一年使用:0次
名校
解题方法
6 . 在入室盗窃类案件中,出现频率最高的痕迹物证之一就是足迹. 负重行走对足迹步伐特征影响的规律强,而且较为稳定. 正在行走的人在负重的同时,步长变短,步宽变大,步角变大. 因此, 以身高分别为170cm, 175cm, 180cm的人员各 20名作为实验对象,让他们采取双手胸前持重物的负重方式行走,得到实验对象在负重0kg,5kg,10kg,15kg,20kg状态下相对稳定的步长数据平均值. 并在不同身高情况下,建立足迹步长s(单位:cm)关于负重x(单位:kg)的三个经验回归方程. 根据身高 170cm组数据建立线性回归方程①: 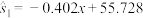 ;根据身高 175cm组数据建立线性回归方程②:
  根据身高 180cm 组数据建立线性回归方程③:
  .
.
(1)根据身高 180cm组的统计数据,求 ,
, 的值,并解释参数的含义;
(2)在一起盗窃案中,被盗窃物品重为9kg,在现场勘查过程中,测量得犯罪嫌疑人往返时足迹步长的差值为4.464cm,推测该名嫌疑人的身高,并说明理由.
附: .为回归方程,
  ,
, ,
, ,
,
;根据身高 175cm组数据建立线性回归方程②: 根据身高 180cm 组数据建立线性回归方程③: .(1)根据身高 180cm组的统计数据,求
,的值,并解释参数的含义;| 身高 180cm不同负重情况下的步长数据平均值 | |||||
| 负重x/kg | 0 | 5 | 10 | 15 | 20 |
| 足迹步长s/cm | 74.35 | 73.50 | 71.80 | 68.60 | 65.75 |
(2)在一起盗窃案中,被盗窃物品重为9kg,在现场勘查过程中,测量得犯罪嫌疑人往返时足迹步长的差值为4.464cm,推测该名嫌疑人的身高,并说明理由.
附:
.为回归方程, ,,,
您最近一年使用:0次
2023-11-26更新
|
554次组卷
|
4卷引用:8.2.2一元线性回归模型参数的最小二乘估计练习
8.2.2一元线性回归模型参数的最小二乘估计练习(已下线)第02讲 8.2 一元线性回归模型及其应用(知识清单+6类热点题型精讲+强化分层精练)-【帮课堂】2023-2024学年高二数学同步学与练(人教A版2019选择性必修第三册)重庆市第八中学校2023-2024学年高三上学期高考适应性月考(三)(11月)数学试题重庆市沙坪坝区重庆八中2024届高三上学期高考适应性月考卷(三)数学试题
名校
7 . 已知高三某学生为了迎接高考,参加了学校的5次模拟考试,其中5次的模拟考试成绩如表所示,
设变量x,y满足回归直线方程 .
.
(1)假如高考也符合上述的模拟考试的回归直线方程,高考看作第10次模拟考试,预测2024年的高考的成绩;
(2)从上面的5次考试成绩中随机抽取3次,其中2次成绩都大于500分的概率.
参考公式:回归直线方程中的斜率和截距的最小二乘估计公式分别为 ,
, .
.
| 次数(x) | 1 | 2 | 3 | 4 | 5 |
| 考试成绩(y) | 498 | 499 | 497 | 501 | 505 |
.(1)假如高考也符合上述的模拟考试的回归直线方程,高考看作第10次模拟考试,预测2024年的高考的成绩;
(2)从上面的5次考试成绩中随机抽取3次,其中2次成绩都大于500分的概率.
参考公式:回归直线方程
中的斜率和截距的最小二乘估计公式分别为,.
您最近一年使用:0次
名校
解题方法
8 . 下面给出了根据我国 年
年 年水果人均占有量(单位:
 )和年份代码绘制的散点图(年年的年份代码分别为
 ).
).
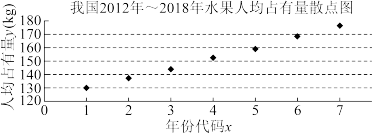
(1)根据散点图分析与之间的相关关系;
(2)根据散点图相应数据计算得 ,
, ,求关于的线性回归方程.(精确到
 )
)
附:回归方程中斜率和截距的最小二乘估计公式分别为:
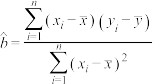 ,
,
年年水果人均占有量(单位:)和年份代码绘制的散点图(年年的年份代码分别为). (1)根据散点图分析
与之间的相关关系;(2)根据散点图相应数据计算得
,,求关于的线性回归方程.(精确到)附:回归方程
中斜率和截距的最小二乘估计公式分别为:,
您最近一年使用:0次
解题方法
9 . 某种产品的广告费支出x(单位:万元)与销售额y(万元)之间有如下一组数据:
(1)求出样本点中心
(2)求回归直线方程(其中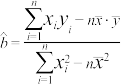 ,)
,)
| 广告费支出x | 2 | 4 | 5 | 6 | 8 |
| 销售额y | 30 | 40 | 60 | 50 | 70 |
(2)求回归直线方程(其中
,)
您最近一年使用:0次
2023-09-01更新
|
151次组卷
|
4卷引用:第02讲 8.2 一元线性回归模型及其应用(知识清单+6类热点题型精讲+强化分层精练)-【帮课堂】2023-2024学年高二数学同步学与练(人教A版2019选择性必修第三册)
(已下线)第02讲 8.2 一元线性回归模型及其应用(知识清单+6类热点题型精讲+强化分层精练)-【帮课堂】2023-2024学年高二数学同步学与练(人教A版2019选择性必修第三册)(已下线)8.2 一元线性回归模型及其应用——课堂例题甘肃省兰州市等4地2022届高三一模理科数学试题(已下线)考点16 回归模型 2024届高考数学考点总动员【练】
22-23高二下·江苏·课后作业
解题方法
10 . 某种产品的广告费支出x(单位:百万元)与销售额y(单位:百万元)之间有如下对应数据:
(1)画出散点图;
(2)求回归直线方程.
参考公式
x | 2 | 4 | 5 | 6 | 8 |
y | 30 | 40 | 60 | 50 | 70 |
(2)求回归直线方程.
参考公式
您最近一年使用:0次


