1 . 某公司为确定下一年度投入某种产品的宣传费,需了解年宣传费 (单位:万元)对年销售量
 (单位:吨)和年利润
 (单位:万元)的影响.对近六年的年宣传费
 和年销售量
和年销售量 的数据作了初步统计,得到如下数据:
经电脑模拟,发现年宣传费(万元)与年销售量(吨)之间近似满足关系式 ,即
,即 .对上述数据作了初步处理,得到相关的值如下表:
(1)根据所给数据,求关于的回归方程;
(2)规定当产品的年销售量(吨)与年宣传费(万元)的比值在区间 内时认为该年效益良好.该公司某
 年投入的宣传费用(单位:万元)分别为:
 、
、 、
、 、
、 、
、 、
、 ,试根据回归方程估计年销售量,从这年中任选
 年,记其中选到效益良好年的数量为
 ,试求随机变量的分布列和期望.(其中
 为自然对数的底数,
 )
)
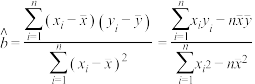
附:对于一组数据 ,
, ,…,
,…, ,其回归直线
 中的斜率和截距的最小二乘估计分别为
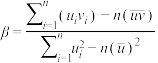 ,
, .
.
(单位:万元)对年销售量(单位:吨)和年利润(单位:万元)的影响.对近六年的年宣传费和年销售量的数据作了初步统计,得到如下数据:| 年份 | 2011 | 2012 | 2013 | 2014 | 2015 | 2016 |
| 年宣传费(万元) | 38 | 48 | 58 | 68 | 78 | 88 |
| 年销售量(吨) | 16.8 | 18.8 | 20.7 | 22.4 | 24.0 | 25.5 |
(万元)与年销售量(吨)之间近似满足关系式,即.对上述数据作了初步处理,得到相关的值如下表:
|
|
|
|
75.3 | 24.6 | 18.3 | 101.4 |


 关于的回归方程;
(2)规定当产品的年销售量
(吨)与年宣传费(万元)的比值在区间内时认为该年效益良好.该公司某年投入的宣传费用(单位:万元)分别为:、、、、、,试根据回归方程估计年销售量,从这年中任选年,记其中选到效益良好年的数量为,试求随机变量的分布列和期望.(其中为自然对数的底数,)附:对于一组数据
,,…,,其回归直线中的斜率和截距的最小二乘估计分别为,.
您最近一年使用:0次
名校
解题方法
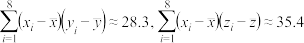
2 . 在一次抽样调查中测得样本的5个样本点,数值如下表:

(1)根据散点图判断, 哪一个适宜作为关于的回归方程类型?(给出判断即可,不必说明理由)
(2)根据(1)的判断结果试建立与之间的回归方程.(注意 或
或 计算结果保留整数)
(3)由(2)中所得设z=+且 ,试求z的最小值.
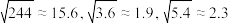
参考数据及公式如下:
 ,
, ,
,

| 0.25 | 0.5 | 1 | 2 | 4 |
| 16 | 12 | 5 | 2 | 1 |
(1)根据散点图判断,
哪一个适宜作为关于的回归方程类型?(给出判断即可,不必说明理由)(2)根据(1)的判断结果试建立
与之间的回归方程.(注意或计算结果保留整数)(3)由(2)中所得设z=
+且,试求z的最小值.参考数据及公式如下:
,,
您最近一年使用:0次
2018-06-01更新
|
774次组卷
|
2卷引用:福建省连城县第一中学2020-2021学年高二下学期第二次月考数学试卷
名校
3 . 大学生赵敏利用寒假参加社会实践,对机械销售公司7月份至12月份销售某种机械配件的销售量及销售单价进行了调查,销售单价x和销售量y之间的一组数据如表所示:
(1)根据7至11月份的数据,求出y关于x的回归直线方程;
(2)若由回归直线方程得到的估计数据与剩下的检验数据的误差不超过0.5元,则认为所得到的回归直线方程是理想的,试问(1)中所得到的回归直线方程是否理想?
(3)预计在今后的销售中,销售量与销售单价仍然服从(1)中的关系,若该种机器配件的成本是2.5元/件,那么该配件的销售单价应定为多少元才能获得最大利润?(注:利润=销售收入-成本).
参考公式:回归直线方程 ,其中
,其中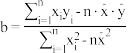 ,参考数据:
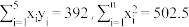 .
.
| 月份i | 7 | 8 | 9 | 10 | 11 | 12 |
| 销售单价xi(元) | 9 | 9.5 | 10 | 10.5 | 11 | 8 |
| 销售量yi(件) | 11 | 10 | 8 | 6 | 5 | 14 |
(2)若由回归直线方程得到的估计数据与剩下的检验数据的误差不超过0.5元,则认为所得到的回归直线方程是理想的,试问(1)中所得到的回归直线方程是否理想?
(3)预计在今后的销售中,销售量与销售单价仍然服从(1)中的关系,若该种机器配件的成本是2.5元/件,那么该配件的销售单价应定为多少元才能获得最大利润?(注:利润=销售收入-成本).
参考公式:回归直线方程
,其中,参考数据:.
您最近一年使用:0次
2017-06-03更新
|
3625次组卷
|
8卷引用:【全国百强校】福建省上杭县第一中学2017-2018学年高一下学期第二次月考(6月)数学试题
名校
4 . 某种商品价格与该商品日需求量之间的几组对照数据如下表:
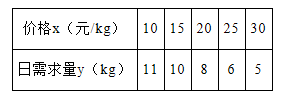
(1)求关于的线性回归方程;
(2)利用(1)中的回归方程,当价格 元/
元/ 时,日需求量的预测值为多少?
参考公式:线性回归方程 ,其中
,其中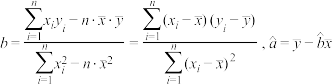
(1)求
关于的线性回归方程;(2)利用(1)中的回归方程,当价格
元/时,日需求量的预测值为多少?参考公式:线性回归方程
,其中
您最近一年使用:0次
2017-03-03更新
|
3698次组卷
|
7卷引用:福建省建瓯市芝华中学2019-2020学年高二下学期第一次阶段考试数学试题
福建省建瓯市芝华中学2019-2020学年高二下学期第一次阶段考试数学试题2016-2017学年山东省德州市高一上学期期末检测数学试卷12016-2017学年山东省德州市高一上学期期末检测数学试卷2新疆昌吉州教育共同体2020-2021学年高二上学期期中考试数学试题(已下线)专题4.7一元线性回归模型(A卷基础篇)-2020-2021学年高二数学选择性必修第二册同步单元AB卷(新教材人教B版)甘肃省金昌市永昌县第一高级中学2021-2022学年高二下学期第一次月考数学(文)试题(已下线)第四章 概率与统计章末检测(基础篇)-2021-2022学年高二数学同步知识梳理+考点精讲精练(人教B版2019选择性必修第二册)
5 . 某产品的广告费用与销售额的统计数据如下表
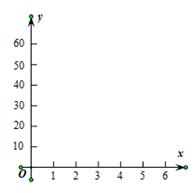
(Ⅰ)画出散点图;
(Ⅱ)求出对的线性回归直线的方程 (其中
(其中 );
);
(Ⅲ)若广告费用为6万元,则销售额大约为多少万元.
与销售额的统计数据如下表| 广告费用(万元) | 4 | 2 | 3 | 5 |
| 销售额(万元) | 49 | 26 | 39 | 54 |
(Ⅱ)求出
对的线性回归直线的方程(其中);(Ⅲ)若广告费用为6万元,则销售额大约为多少万元.
您最近一年使用:0次
6 . 某农科所对冬季昼夜温差大小与某反季节大豆新品种发芽多少之间的关系进行分析研究,他们分别记录了12月1日至12月5日的每天昼夜温差与实验室每天每100颗种子中的发芽数,得到如下资料:
(1)请根据12月2日至12月4日的数据,求出y关于x的线性回归方程 (其中已计算出
 );
);
(2)若由线性回归方程得到的估计数据与所选出的检验数据(选取的检验数据是12月1日与12月5日的两组数据)的误差均不超过2颗,则认为得到的线性回归方程是可靠的,试问(2)中所得的线性回归方程是否可靠?
| 日 期 | 12月1日 | 12月2日 | 12月3日 | 12月4日 | 12月5日 |
| 温差x(°C) | 10 | 11 | 13 | 12 | 8 |
| 发芽数y(颗) | 23 | 25 | 30 | 26 | 16 |
(其中已计算出);(2)若由线性回归方程得到的估计数据与所选出的检验数据(选取的检验数据是12月1日与12月5日的两组数据)的误差均不超过2颗,则认为得到的线性回归方程是可靠的,试问(2)中所得的线性回归方程是否可靠?
您最近一年使用:0次
7 . 为分析肥胖程度对总胆固醇与空腹血糖的影响, 在肥胖人群中随机抽出 人,他们的肥胖指数
 值、总胆固醇
 指标值(单位:
 )、空腹血糖
 指标值(单位:)如下表所示:
(1)用变量与 与的相关系数, 分别说明指标值与值、指标值与值的相关程度;
(2)求与的线性回归方程, 已知指标值超过 为总胆固醇偏高, 据此模型分析当值达到多大时, 需要注意监控总胆固醇偏高情况的出现(上述数据均要精确到
 ).
).
参考公式:相关系数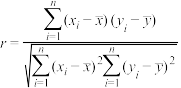
回归直线的方程是: 其中
其中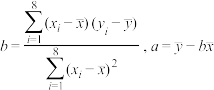
参考数据:
 ,
, .
.
人,他们的肥胖指数值、总胆固醇指标值(单位:)、空腹血糖指标值(单位:)如下表所示:| 人员编号 |  |  | |  |  | |  | |
| 值 |  |  |  |  |  |  | |  |
| 指标值 |  |  |  |  |  |  |  |  |
| 指标值 |  |  |  |  |  |  |  |  |
与与的相关系数, 分别说明指标值与值、指标值与值的相关程度;(2)求
与的线性回归方程, 已知指标值超过为总胆固醇偏高, 据此模型分析当值达到多大时, 需要注意监控总胆固醇偏高情况的出现(上述数据均要精确到).参考公式:相关系数
回归直线的方程是:
其中参考数据:
,.
您最近一年使用:0次
名校
8 . 通过市场调查,得到某种产品的资金投入x(单位:万元)与获得的利润y(单位:万元)的数据,如表所示:
(1)画出数据对应的散点图;
(2)根据上表提供的数据,用最小二乘法求线性回归直线方程;
(3)现投入资金10万元,求获得利润的估计值为多少万元?
参考公式: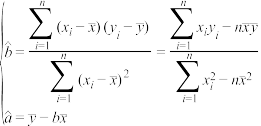
| 资金投入x | 2 | 3 | 4 | 5 | 6 |
| 利润y | 2 | 3 | 5 | 6 | 9 |
(2)根据上表提供的数据,用最小二乘法求线性回归直线方程
;(3)现投入资金10万元,求获得利润的估计值为多少万元?
参考公式:
您最近一年使用:0次
2016-12-04更新
|
842次组卷
|
6卷引用:2015-2016学年福建省四地六校高二下学期第一次联考文科数学试卷
9 . 某工厂为了对新研发的一种产品进行合理定价,将该产品按事先拟定的价格进行试销,得到如下数据:

(1)求回归直线方程 ,其中
,其中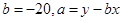 ;
;
(2)预计在今后的销售中,销量与单价仍然服从(1)中的关系,且该产品的成本是 元/件,为使工厂获得最大利润,该产品的单价应定为多少元?(利润=销售收入-成本)
(1)求回归直线方程
,其中;(2)预计在今后的销售中,销量与单价仍然服从(1)中的关系,且该产品的成本是
元/件,为使工厂获得最大利润,该产品的单价应定为多少元?(利润=销售收入-成本)
您最近一年使用:0次
10 . 下表提供了某厂节能降耗技术改造后生产甲产品过程中记录的产量(吨)与相应的生产能耗
(吨标准煤)的几组对照数据:
(1)请根据上表提供的数据,用最小二乘法求出关于的线性回归方程;
(2)已知该厂技改前50吨甲产品的生产能耗为45吨标准煤,试根据(1)求出的线性回归方程,预测生产50吨甲产品的生产能耗比较改前降低了多少吨标准煤?
(参考公式: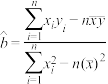 ,参考数值:
 )
)
(吨)与相应的生产能耗(吨标准煤)的几组对照数据:| x | 3 | 4 | 5 | 6 |
| y | 2.5 | 3 | 4 | 4.5 |
关于的线性回归方程;(2)已知该厂技改前50吨甲产品的生产能耗为45吨标准煤,试根据(1)求出的线性回归方程,预测生产50吨甲产品的生产能耗比较改前降低了多少吨标准煤?
(参考公式:
,参考数值:)
您最近一年使用:0次


