名校
解题方法
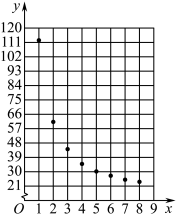
1 . 某车间为了规定工时额,需确定加工零件所花费的时间,为此做了4次试验,得到的数据如下图:若加工时间 (小时)与零件个数
 之间有较好的线性相关关系.
(1)求加工时间与零件个数的线性回归方程 ;
;
(2)试预报加工10个零件需要的时间.
附:回归方程系数公式: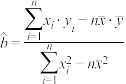 ,
, .
.
(小时)与零件个数之间有较好的线性相关关系. | 2 | 3 | 5 | 6 |
| 2.5 | 3 | 5 | 5.5 |
(1)求加工时间与零件个数的线性回归方程
;(2)试预报加工10个零件需要的时间.
附:回归方程系数公式:
,.
您最近一年使用:0次
2020-06-19更新
|
165次组卷
|
2卷引用:福建省莆田第一中学2019-2020学年高二下学期期中考试数学试题
2 . 某火锅店为了解气温对营业额的影响,随机记录了该店1月份中5天的日营业额y(单位:千元)与该地当日最低气温x(单位:℃)的数据,如下表:
(1)求y关于x的回归方程;
(2)判定y与x之间是正相关还是负相关;若该地1月份某天的最低气温为6℃,用所求回归方程预测该店当日的营业额;
附:① ;
; .
.
②参考数据如下:
| x | 2 | 5 | 8 | 9 | 11 |
| y | 12 | 10 | 8 | 8 | 7 |
;(2)判定y与x之间是正相关还是负相关;若该地1月份某天的最低气温为6℃,用所求回归方程预测该店当日的营业额;
附:①
;.②参考数据如下:
| i |  |  |  |  |
| 1 | 2 | 12 | 4 | 24 |
| 2 | 5 | 10 | 25 | 50 |
| 3 | 8 | 8 | 64 | 64 |
| 4 | 9 | 8 | 81 | 72 |
| 5 | 11 | 7 | 121 | 77 |
 | 35 | 45 | 295 | 287 |
您最近一年使用:0次
解题方法
3 . 某种新产品投放市场一段时间后,经过调研获得了时间(天数)与销售单价(元)的一组数据,且做了一定的数据处理(如表),并作出了散点图(如图).
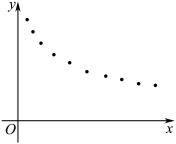
表中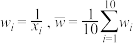 .
.
(1)根据散点图判断, 与
与 哪一个更适合作价格关于时间的回归方程类型?(不必说明理由)
(2)根据判断结果和表中数据,建立关于的回归方程.
(3)若该产品的日销售量 (件)与时间的函数关系为
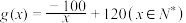 ,求该产品投放市场第几天的销售额最高?最高为多少元?
附:对于一组数据 ,其回归直线
 的斜率和截距的最小二乘法估计分别为
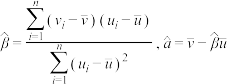 .
.
(天数)与销售单价(元)的一组数据,且做了一定的数据处理(如表),并作出了散点图(如图). |  |  |  |  | 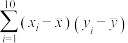 | 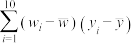 |
| 1.63 | 37.8 | 0.89 | 5.15 | 0.92 |  | 18.40 |
表中
.(1)根据散点图判断,
与哪一个更适合作价格关于时间的回归方程类型?(不必说明理由)(2)根据判断结果和表中数据,建立
关于的回归方程.(3)若该产品的日销售量
(件)与时间的函数关系为,求该产品投放市场第几天的销售额最高?最高为多少元?附:对于一组数据
,其回归直线的斜率和截距的最小二乘法估计分别为.
您最近一年使用:0次
2020-06-13更新
|
895次组卷
|
5卷引用:福建省福州市八县(市)协作体2019-2020学年高二下学期期末联考数学试题
福建省福州市八县(市)协作体2019-2020学年高二下学期期末联考数学试题山西省太原师院附中、师苑中学2018-2019学年高二下学期第三次月考数学(文)试题福建省泉州第十一中学等六校2020-2021学年高二下学期期末考试数学试题(已下线)8.2 一元线性回归模型及其应用(精讲)-2020-2021学年高二数学一隅三反系列(人教A版2019选择性必修第三册)(已下线)专题36 相关关系与线性回归模型及其应用-2020-2021学年高中数学新教材人教A版选择性必修配套提升训练
4 . 某企业新研发了一种产品,产品的成本由原料成本及非原料成本组成.每件产品的非原料成本(元)与生产该产品的数量(千件)有关,经统计得到如下数据:
根据以上数据,绘制了散点图.观察散点图,两个变量不具有线性相关关系,现考虑用反比例函数模型 和指数函数模型
 分别对两个变量的关系进行拟合,已求得:用指数函数模型拟合的回归方程为
 ,
, 与的相关系数
 ;
; ,
, ,
, ,
, ,
, ,
, ,(其中
,(其中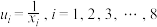 );
);
(1)用反比例函数模型求关于的回归方程;
(2)用相关系数判断上述两个模型哪一个拟合效果更好(精确到0.01),并用其估计产量为10千件时每件产品的非原料成本.
参考数据: ,
,
参考公式:对于一组数据 ,
, ,…,
,…, ,其回归直线
 的斜率和截距的最小二乘估计分别为:
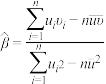 ,
, ,相关系数
,相关系数 .
.
(元)与生产该产品的数量(千件)有关,经统计得到如下数据:| x | 1 | 2 | 3 | 4 | 5 | 6 | 7 | 8 |
| y | 112 | 61 | 44.5 | 35 | 30.5 | 28 | 25 | 24 |
和指数函数模型分别对两个变量的关系进行拟合,已求得:用指数函数模型拟合的回归方程为,与的相关系数;,,,,,,(其中);(1)用反比例函数模型求
关于的回归方程;(2)用相关系数判断上述两个模型哪一个拟合效果更好(精确到0.01),并用其估计产量为10千件时每件产品的非原料成本.
参考数据:
,参考公式:对于一组数据
,,…,,其回归直线的斜率和截距的最小二乘估计分别为:,,相关系数.
您最近一年使用:0次
名校
解题方法
5 . 某省级示范高中高三年级对各科考试的评价指标中,有“难度系数“和“区分度“两个指标中,难度系数 ,区分度
,区分度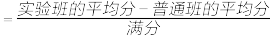 .
.
(1)某次数学考试(满分为150分),随机从实验班和普通班各抽取三人,实验班三人的成绩分别为147,142,137;普通班三人的成绩分别为97,102,113.通过样本估计本次考试的区分度(精确0.01).
(2)如表表格是该校高三年级6次数学考试的统计数据:
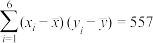
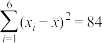
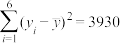
①计算相关系数r,|r|<0.75时,认为相关性弱;|r|≥0.75时,认为相关性强.通过计算说明,能否利用线性回归模型描述y与x的关系(精确到0.01).
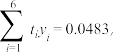
②ti=|xi﹣0.74|(i=1,2,…,6),求出y关于t的线性回归方程,并预测x=0.75时y的值(精确到0.01).
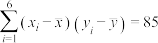
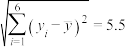
附注:参考数据: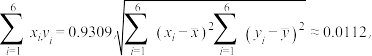

参考公式:相关系数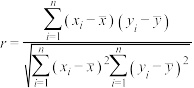 r,回归直线
 的斜率和截距的最小二乘估计分别为
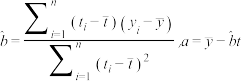
,区分度.(1)某次数学考试(满分为150分),随机从实验班和普通班各抽取三人,实验班三人的成绩分别为147,142,137;普通班三人的成绩分别为97,102,113.通过样本估计本次考试的区分度(精确0.01).
(2)如表表格是该校高三年级6次数学考试的统计数据:
| 难度系数x | 0.64 | 0.71 | 0.74 | 0.76 | 0.77 | 0.82 |
| 区分度y | 0.18 | 0.23 | 0.24 | 0.24 | 0.22 | 0.15 |
①计算相关系数r,|r|<0.75时,认为相关性弱;|r|≥0.75时,认为相关性强.通过计算说明,能否利用线性回归模型描述y与x的关系(精确到0.01).
②ti=|xi﹣0.74|(i=1,2,…,6),求出y关于t的线性回归方程,并预测x=0.75时y的值(精确到0.01).
附注:参考数据:
参考公式:相关系数
r,回归直线的斜率和截距的最小二乘估计分别为
您最近一年使用:0次
2020-04-30更新
|
1047次组卷
|
5卷引用:福建省安溪一中、养正中学、惠安一中、泉州实验中学2019-2020学年高二下学期期末联考数学试题
名校
6 . 某手机企业为确定下一年度投入某种产品的研发费用,统计了近 年投入的年研发费用千万元与年销售量千万件的数据,得到散点图1,对数据作出如下处理:令
 ,
, ,得到相关统计量的值如图2:


(1)利用散点图判断 和
和
 哪一个更适合作为年研发费用和年销售量的回归类型(不必说明理由),并根据数据,求出与的回归方程;
(2)已知企业年利润 千万元与
千万元与 的关系式为
的关系式为 (其中
(其中 为自然对数的底数),根据(1)的结果,要使得该企业下一年的年利润最大,预计下一年应投入多少研发费用?
年投入的年研发费用千万元与年销售量千万件的数据,得到散点图1,对数据作出如下处理:令,,得到相关统计量的值如图2:(1)利用散点图判断
和哪一个更适合作为年研发费用和年销售量的回归类型(不必说明理由),并根据数据,求出与的回归方程;(2)已知企业年利润
千万元与的关系式为(其中为自然对数的底数),根据(1)的结果,要使得该企业下一年的年利润最大,预计下一年应投入多少研发费用?
您最近一年使用:0次
2020-04-14更新
|
920次组卷
|
6卷引用:福建省莆田第二十四中学2019-2020学年高二下学期返校测试数学(文)试题
福建省莆田第二十四中学2019-2020学年高二下学期返校测试数学(文)试题河南省郑州市中牟县2018-2019学年高二下学期期中考试文数试题甘肃省张掖市山丹县第一中学2019-2020学年高二下学期期中考试数学(文)试题河南省郑州市中牟县2018-2019学年高二下学期期中考试理数试题(已下线)考点43 变量间的相关关系-备战2021年高考数学(文)一轮复习考点一遍过(已下线)考点45 变量间的相关关系-备战2021年高考数学(理)一轮复习考点一遍过
名校
解题方法
7 . 某生物小组为了研究温度对某种酶的活性的影响进行了一组实验,得到的实验数据经整理得到如下的折线图:

(1)由图可以看出,这种酶的活性与温度具有较强的线性相关性,请用相关系数加以说明;
(2)求关于的线性回归方程,并预测当温度为 时,这种酶的活性指标值.(计算结果精确到0.01)
参考数据: ,
, ,
, ,
, .
.
参考公式:相关系数.
回归直线方程 ,
, ,
, .
.
(1)由图可以看出,这种酶的活性
与温度具有较强的线性相关性,请用相关系数加以说明;(2)求
关于的线性回归方程,并预测当温度为时,这种酶的活性指标值.(计算结果精确到0.01)参考数据:
,,,.参考公式:相关系数
.回归直线方程
,,.
您最近一年使用:0次
2020-04-12更新
|
984次组卷
|
6卷引用:福建省龙岩市武平县第一中学2020-2021学年高二上学期月考数学试题
解题方法
8 . 如表是某位文科生连续 次月考的历史、政治的成绩,结果如下:
(1)求该生次月考历史成绩的平均分和政治成绩的平均数;
(2)一般来说,学生的历史成绩与政治成绩有较强的线性相关关系,根据上表提供的数据,求两个变量 的线性回归方程.
参考公式: ,,表示样本均值.
次月考的历史、政治的成绩,结果如下:月份 | 9 | 10 | 11 | 12 | 1 |
历史( | 79 | 81 | 83 | 85 | 87 |
政治( | 77 | 79 | 79 | 82 | 83 |
次月考历史成绩的平均分和政治成绩的平均数;(2)一般来说,学生的历史成绩与政治成绩有较强的线性相关关系,根据上表提供的数据,求两个变量
的线性回归方程.参考公式:
,,表示样本均值.
您最近一年使用:0次
2020-04-10更新
|
512次组卷
|
3卷引用:福建省长汀县龙宇中学2021届高三上学期特长生数学试题
名校
解题方法
9 . 受传统观念的影响,中国家庭教育过程中对子女教育的投入不遗余力,基础教育消费一直是中国家庭教育的重头戏,升学压力的逐渐增大,特别是对于升入重点学校的重视,导致很多家庭教育支出增长较快,下面是某机构随机抽样调查某二线城市2012-2018年的家庭教育支出的折线图.
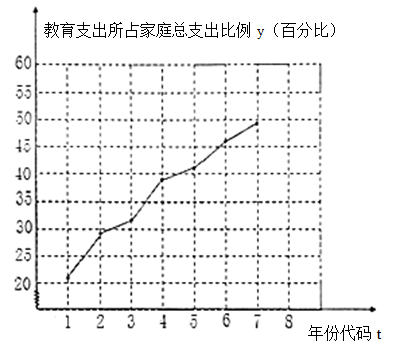
(附:年份代码1-7分别对应的年份是2012-2018)
(1)从图中的折线图看出,可用线性回归模型拟合y与t的关系,请求出相关系数r(精确到0.001),并指出是哪一层次的相关性?(相关系数 ,相关性很强;
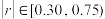 ,相关性一般;
 ,相关性较弱).
(2)建立y关于t的回归方程;
(3)若2019年该地区家庭总支出为10万元,预测家庭教育支出约为多少万元?
附注:参考数据: ,
, ,
,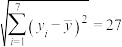 ,
,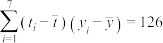 ,
, .
.
参考公式: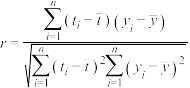 ,回归方程
,回归方程 ,
,
其中 ,
, .
.
(附:年份代码1-7分别对应的年份是2012-2018)
(1)从图中的折线图看出,可用线性回归模型拟合y与t的关系,请求出相关系数r(精确到0.001),并指出是哪一层次的相关性?(相关系数
,相关性很强;,相关性一般;,相关性较弱).(2)建立y关于t的回归方程;
(3)若2019年该地区家庭总支出为10万元,预测家庭教育支出约为多少万元?
附注:参考数据:
,,,,.参考公式:
,回归方程,其中
,.
您最近一年使用:0次
2020-04-08更新
|
391次组卷
|
3卷引用:福建省宁德第一中学2020-2021学年高二上学期开学检测数学试题
名校
10 . 一只药用昆虫的产卵数y与一定范围内的温度x有关,现收集了该种药用昆虫的6组观测数据如下表:
经计算得:
 ,
, ,
, 线性回归模型的残差平方和
 ,
, ,
,
其中 分别为观测数据中的温度和产卵数,
(1)若用线性回归模型,求y关于x的回归方程 (精确到0.1);
(2)若用非线性回归模型求得y关于x的回归方程为 ,且相关指数
 .
.
①试与1中的回归模型相比,用 说明哪种模型的拟合效果更好.
②用拟合效果好的模型预测温度为35℃时该用哪种药用昆虫的产卵数(结果取整数)
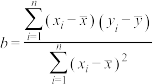
附:一组数据 其回归直线的斜率和截距的最小二乘估计为
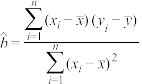 ,
, ;相关指数
;相关指数 .
.
| 温度x/℃ | 21 | 23 | 24 | 27 | 29 | 32 |
| 产卵数y/个 | 6 | 11 | 20 | 27 | 57 | 77 |
经计算得:
,,线性回归模型的残差平方和,,其中
分别为观测数据中的温度和产卵数,(1)若用线性回归模型,求y关于x的回归方程
(精确到0.1);(2)若用非线性回归模型求得y关于x的回归方程为
,且相关指数.①试与1中的回归模型相比,用
说明哪种模型的拟合效果更好.②用拟合效果好的模型预测温度为35℃时该用哪种药用昆虫的产卵数(结果取整数)
附:一组数据
其回归直线的斜率和截距的最小二乘估计为,;相关指数.
您最近一年使用:0次
2020-03-28更新
|
1029次组卷
|
16卷引用:【校级联考】福建省三明市三地三校2018-2019学年高二下学期期中联考数学(文)试题
【校级联考】福建省三明市三地三校2018-2019学年高二下学期期中联考数学(文)试题福建省泉州市四校(晋江磁灶中学等)2019-2020学年高二下学期期中联考数学试题广东省茂名市2018届高三上学期第一次综合测试数学(文)试题河北省衡水中学2018届高三第十次模拟考试数学(文)试题【全国校级联考】河南省名校2018届高三压轴第二次考试文科数学试题【全国百强校】河南省巩义市市直高中2018届高三下学期模拟考试数学(理)试题四川省眉山一中2017-2018学年高二下学期4月月考数学(文)试题【全国校级联考】山东、湖北部分重点中学2018届高三高考冲刺模拟试卷(五) 文科数学试题【全国百强校】贵州省铜仁市第一中学2018-2019学年高二上学期期末考试数学(理科)试题(已下线)2019年3月4日 《每日一题》(理)二轮复习-变量间的相关关系(已下线)2019年3月12日《每日一题》文科二轮复习 变量间的相关关系安徽省定远育才学校2019届高三(文化班)下学期第一次模拟考试数学(文)试题河北省唐山市玉田县2018-2019学年高二下学期期中数学(文)试题湖南省衡阳市衡阳县第四中学2018-2019学年高二(实验班)下学期期末数学(理)试题广东省梅州市五华县五华中学2021-2022学年高二下学期期中数学试题(已下线)第八章 成对数据的统计分析(知识归纳+题型突破)-2023-2024学年高二数学单元速记·巧练(人教A版2019选择性必修第三册)


