1 . 为了节能减排,发展低碳经济,我国政府从2001年起就通过相关政策推动新能源汽车产业发展.下面的图表反映了该产业发展的相关信息:
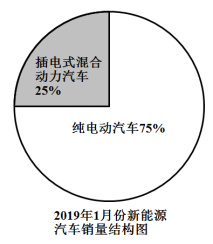
根据上述图表信息,下列结论错误的是( )
中国新能源汽车产销情况一览表 | ||||
新能源汽车生产情况 | 新能源汽车销售情况 | |||
产品(万辆) | 比上年同期 | 销量(万辆) | 比上年同期 | |
2018年3月 | 6.8 | 105 | 6.8 | 117.4 |
4月 | 8.1 | 117.7 | 8.2 | 138.4 |
5月 | 9.6 | 85.6 | 10.2 | 125.6 |
6月 | 8.6 | 31.7 | 8.4 | 42.9 |
7月 | 9 | 53.6 | 8.4 | 47.7 |
8月 | 9.9 | 39 | 10.1 | 49.5 |
9月 | 12.7 | 64.4 | 12.1 | 54.8 |
10月 | 14.6 | 58.1 | 13.8 | 51 |
11月 | 17.3 | 36.9 | 16.9 | 37.6 |
1-12月 | 127 | 59.9 | 125.6 | 61.7 |
2019年1月 | 9.1 | 113 | 9.6 | 138 |
2月 | 5.9 | 50.9 | 5.3 | 53.6 |
根据上述图表信息,下列结论错误的是( )
A.2017年3月份我国新能源汽车的产量不超过 万辆 万辆 |
B.2017年我国新能源汽车总销量超过 万辆 万辆 |
| C.2018年8月份我国新能源汽车的销量高于产量 |
D.2019年1月份我国插电式混合动力汽车的销量低于 万辆 万辆 |
您最近一年使用:0次
2020-01-11更新
|
564次组卷
|
3卷引用:第二章 推理与证明(能力提升)-2020-2021学年高二数学单元测试定心卷(人教版选修2-2)
(已下线)第二章 推理与证明(能力提升)-2020-2021学年高二数学单元测试定心卷(人教版选修2-2)河南省洛阳市2019-2020学年高三上学期第一次统一考试(1月)数学(文)试题河南省洛阳市2019-2020学年高三上学期第一次统一考试(1月)数学(理)试题
2 . 某超市计划按月订购一种酸奶,每天进货量相同,进货成本每瓶4元,售价每瓶7元,未售出的酸奶降价处理,以每瓶1.5元的价格当天全部处理完.据往年销售经验,每天需求量与当天最高气温(单位: )有关,如果最高气温不低于25,需求量为500瓶;如果最高气温位于区间
 ,需求量为300瓶;如果最高气温低于20,需求量为200瓶,为了确定六月份的订购计划,统计了前三年六月份各天的最高气温数据,得到下面的频数分布表:
以最高气温位于各区间的频率代替最高气温位于该区间的概率.
(1)求六月份这种酸奶一天的需求量不超过300瓶的概率;
(2)设六月份一天销售这种酸奶的利润为 (单位:元),若该超市在六月份每天的进货量均为450瓶,写出的所有可能值,
并估计 大于零的概率 .
)有关,如果最高气温不低于25,需求量为500瓶;如果最高气温位于区间,需求量为300瓶;如果最高气温低于20,需求量为200瓶,为了确定六月份的订购计划,统计了前三年六月份各天的最高气温数据,得到下面的频数分布表:最高气温 |
|
|
|
|
|
|
天数 | 2 | 14 | 34 | 27 | 9 | 4 |


(1)求六月份这种酸奶一天的需求量不超过300瓶的概率;
(2)设六月份一天销售这种酸奶的利润为
(单位:元),若该超市在六月份每天的进货量均为450瓶,写出的所有可能值,
您最近一年使用:0次
解题方法
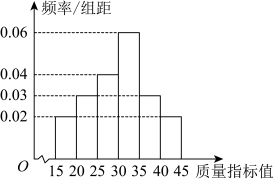
3 . 为了提高生产效率,某企业引进一批新的生产设备,为了解设备生产产品的质量情况,分别从新、旧设备所生产的产品中各随机抽取100件产品进行质量检测,所有产品的质量指标值均在 内,规定质量指标值在
 内的产品为优质品,质量指标值在
 内的产品为合格品.旧设备所生产产品的质量指标值如频率分布直方图所示,新设备所生产产品的质量指标值如频数分布表所示.
(1)请分别估计新、旧设备所生产产品的优质品率;
(2)优质品率是衡量一台设备性能高低的一个重要指标,优质品率越高说明设备的性能越好,根据已知图表中的数据填写下面列联表(单位:件),并判断是否有95%的把握认为产品质量的高低与设备的新旧有关;
附: .
.
(3)已知每件产品的纯利润(单位:元)与产品的质量指标值 的关系式为
的关系式为 ,若每台新设备每天可以生产1000件产品,买一台新设备需要80万元,请估计至少需要生产多少天可以收回设备成本.
内,规定质量指标值在内的产品为优质品,质量指标值在内的产品为合格品.旧设备所生产产品的质量指标值如频率分布直方图所示,新设备所生产产品的质量指标值如频数分布表所示.质量指标值 | 频数 |
| 2 |
| 8 |
| 20 |
| 30 |
| 25 |
| 15 |
总计 | 100 |


(2)优质品率是衡量一台设备性能高低的一个重要指标,优质品率越高说明设备的性能越好,根据已知图表中的数据填写下面列联表(单位:件),并判断是否有95%的把握认为产品质量的高低与设备的新旧有关;
产品质量情况 设备情况 | 合格品 | 优质品 | 总计 |
新设备 | |||
旧设备 | |||
总计 |
.(3)已知每件产品的纯利润
(单位:元)与产品的质量指标值的关系式为,若每台新设备每天可以生产1000件产品,买一台新设备需要80万元,请估计至少需要生产多少天可以收回设备成本.
您最近一年使用:0次
2021-09-24更新
|
109次组卷
|
2卷引用:北师大版(2019) 选修第一册 突围者 第七章 第三节 独立性检验
真题
名校
4 . 某超市计划按月订购一种酸奶,每天进货量相同,进货成本每瓶4元,售价每瓶6元,未售出的酸奶降价处理,以每瓶2元的价格当天全部处理完.根据往年销售经验,每天需求量与当天最高气温(单位:℃)有关.如果最高气温不低于25,需求量为500瓶;如果最高气温位于区间[20,25),需求量为300瓶;如果最高气温低于20,需求量为200瓶.为了确定六月份的订购计划,统计了前三年六月份各天的最高气温数据,得下面的频数分布表:
最高气温 | [10,15) | [15,20) | [20,25) | [25,30) | [30,35) | [35,40) |
天数 | 2 | 16 | 36 | 25 | 7 | 4 |
以最高气温位于各区间的频率估计最高气温位于该区间的概率.
(1)求六月份这种酸奶一天的需求量不超过300瓶的概率;
(2)设六月份一天销售这种酸奶的利润为Y(单位:元),当六月份这种酸奶一天的进货量为450瓶时,写出Y的所有可能值,并估计Y大于零的概率.
您最近一年使用:0次
2017-08-07更新
|
19066次组卷
|
66卷引用:湖南省衡阳市第八中学2017-2018学年高二上学期期中考试数学(文)试题
湖南省衡阳市第八中学2017-2018学年高二上学期期中考试数学(文)试题2017-2018学年人教A版高中数学选修2-3 综合质量评估【全国百强校】四川省棠湖中学2017-2018学年高二零诊模拟数学(理)试题【全国百强校】吉林省长春外国语学校2017-2018学高二下学期期末考试数学(文)试题【全国百强校】吉林省长春外国语学校2017-2018学高二下学期期末考试数学(理)试题【全国校级联考】湖南省衡阳县2017-2018学年高二下学期期末考试数学(文)试题【全国百强校】黑龙江省大庆实验中学2018-2019学年高二上学期期中考试数学(文)试题(已下线)2019年6月22日 《每日一题》文数-周末培优河北省安平中学2020-2021学年高二上学期第一次月考数学试题广东省佛山市南海区狮山石门高级中学2021-2022学年高二上学期第一次统测数学试题河南省安阳市林州市第一中学2022-2023学年高二下学期7月月考数学试题四川省成都市龙泉驿区东竞高级中学2023-2024学年高二上学期期中数学试题2017年全国普通高等学校招生统一考试文科数学(新课标3卷精编版)河南省中原名校2018届高三第三次质量考评试卷理科数学试题人教A版高中数学必修三 学业质量标准检测 算法初步和统计2018届高考数学高考复习指导大二轮专题复习:专题七 概率与统计 测试题7(已下线)《考前20天终极攻略》5月30日 概率【理科】(已下线)《考前20天终极攻略》5月30日 概率【文科】(已下线)《高频考点解密》—解密25 概率(已下线)解密23 概率-备战2018年高考文科数学之高频考点解密【全国百强校】北京市人大附中2018届高三5月考前热身练习(三模)数学文科试题北京市人大附中2018届高三下学期三模考试数学(文科)试题【市级联考】长春市普通高中2019届高三质量监测(一)文科数学试题湖南省长沙市雅礼中学2019届高三上学期月考二数学(理)试题【全国百强校】云南省昆明市黄冈实验学校2019届高三上学期期末考试数学(文)试题智能测评与辅导[文]-概率与统计(已下线)7.概率与统计[文] -《备战2020年高考精选考点专项突破题集》(已下线)专题11.4 随机事件的概率(讲)【理】-《2020年高考一轮复习讲练测》(已下线)专题10.4 随机事件的概率(讲)【文】-《2020年高考一轮复习讲练测》(已下线)专题10.4 随机事件的概率(练)【文】-《2020年高考一轮复习讲练测》(已下线)专题11.4 随机事件的概率(练)【理】-《2020年高考一轮复习讲练测》人教B版(2019) 必修第二册 逆袭之路 第五章 统计与概率 专题二 高考中的统计与概率问题人教A版(2019) 必修第二册 逆袭之路 第十章 概率 专题七 高考中的概率问题人教A版(2019) 必修第二册 过关斩将 第十章 10.2~10.3 综合拔高练人教A版(2019) 必修第二册 必杀技 第10章 素养检测(已下线)卷10-备战2020年新高考数学自学检测黄金10卷-《2020年新高考政策解读与配套资源》(已下线)基础套餐练02-【新题型】2020年新高考数学多选题与热点解答题组合练2020届江西省南昌市江西师范大学附属中学高三第一次模拟测试卷理科数学湖南省衡阳市第八中学2018-2019学年高三下学期第十二次月考数学(文)试题(已下线)专题16 概率与统计综合-五年(2016-2020)高考数学(文)真题分项山东省青岛市胶州市实验中学2019-2020学年第二学期高一数学期中模拟检测(二)(已下线)考点31 统计、统计案例-2021年新高考数学一轮复习考点扫描(已下线)专题11.3 随机事件的概率(精讲)-2021年高考数学(理)一轮复习讲练测(已下线)考点45 随机事件的概率-备战2021年高考数学(文)一轮复习考点一遍过安徽省合肥市第十中学2020-2021学年高三上学期12月阶段性检测数学(文)试题河北省衡水市安平中学2020-2021学年高一下学期期末数学试题(已下线)专题14 概率统计-十年(2012-2021)高考数学真题分项汇编(全国通用)新疆哈密市第十五中学2022届高三上学期第一次月考数学试题(已下线)专题09 概率与统计(文)-五年(2017-2021)高考数学真题分项汇编(文科+理科)(已下线)第51讲 随机事件的概率 (练) — 2022年高考数学一轮复习讲练测(课标全国版)(已下线)第51讲 随机事件的概率 (讲) — 2022年高考数学一轮复习讲练测(课标全国版)(已下线)专题21 概率统计(文科)解答题20题-备战2022年高考数学冲刺横向强化精练精讲(已下线)押全国卷(文科)第18题 概率与统计-备战2022年高考数学(文)临考题号押题(全国卷)(已下线)第02讲 随机事件的概率-【帮课堂】2021-2022学年高一数学同步精品讲义(苏教版2019必修第二册)(已下线)专题10.3 频率与概率-2021-2022学年高一数学课后培优练(人教A版2019必修第二册)福建省厦门第一中学2019-2020学年高一上学期入学考试数学试题(已下线)专题14 概率统计解答题-2(已下线)第69讲 随机事件的概率、古典概型、条件概率(已下线)13.1 随机事件的概率与古典概型(已下线)13.高考大题综合训练[文] -《备战2020年高考精选考点专项突破题集》河南省郑州市新郑市第一中学2022-2023学年高一下学期6月月考数学试题河南省孟津区第一高级中学2022-2023学年高一下学期6月月考数学试题河南省漯河市高级中学2023-2024学年高三上学期摸底考试数学试题北师大版(2019) 必修第一册 数学奇书 第七章 概 率 章末整合提升(已下线)10.3.1频率的稳定性+10.3.2随机模拟【第三练】“上好三节课,做好三套题“高中数学素养晋级之路专题33概率统计解答题(第一部分)
名校
解题方法
5 . 中国独有的文书工具,即笔、墨、纸、砚,有文房四宝之名,起源于南北朝时期.其中宣纸是文房四宝的一种,宣纸“始于唐代,产于泾县”,因唐代泾县隶属宣州管辖,故因地得名宣纸.宣纸按质量等级分为:正牌(优等品)、副牌(合格品)、废品三等.某公司生产的宣纸为纯手工制作,年产宣纸 刀(
刀( 刀
刀 张),该公司按照某种质量指标
 给宣纸确定等级如表所示:
在该公司所生产的宣纸中随机生产了一刀进行检验,得到频率分布直方图如图所示,已知每张正牌宣纸的利润为 元,副牌宣纸利润为
 元,废品的利润为
 元.
元.
(2)市场上有一种售价为 万元的机器可以改进宣纸的生产工艺,但这种机器的使用寿命为一年,只能提高宣纸的质量,不能增加宣纸的年产量;据调查这种机器生产的宣纸的质量指标如表所示:
其中为质量指标x的平均值,但是由于人们对传统手工工艺的认可,改进后的正牌和副牌宣纸的利润都将下降 元/张,请该公司是否购买这种机器,请你为公司提出合理建议,并说明理由.(同一组的数据用该组区间的中点值作代表)
刀(刀张),该公司按照某种质量指标给宣纸确定等级如表所示:
|
|
|
|
质量等级 | 副牌 | 正牌 | 废品 |


 元,副牌宣纸利润为元,废品的利润为元.
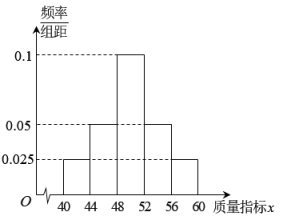
(2)市场上有一种售价为
万元的机器可以改进宣纸的生产工艺,但这种机器的使用寿命为一年,只能提高宣纸的质量,不能增加宣纸的年产量;据调查这种机器生产的宣纸的质量指标如表所示:
|
|
|
频率 |
|
|


 元/张,请该公司是否购买这种机器,请你为公司提出合理建议,并说明理由.(同一组的数据用该组区间的中点值作代表)
您最近一年使用:0次


