名校
解题方法
1 . 经验表明,一般树的胸径(树的主干在地面以上 处的直径)越大,树就越高.由于测量树高比测量胸径困难,因此研究人员希望由胸径预测树高.在研究树高与胸径之间的关系时,某林场收集了某种树的一些数据:
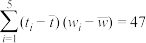
并计算得 ,
, ,
, ,
, ,
, .
.
(1)以胸径为横坐标,树高为纵坐标绘制散点图;
(2)求该林场这种树木的树高 (单位:
(单位: )与胸径
)与胸径 (单位:
(单位: )的样本相关系数
 (精确到
(精确到 );
);
(3)求该林场这种树木的树高(单位:)关于胸径(单位:)的回归直线方程( 精确到),并估计该林场这种树木的胸径为
 时的树高(精确到
 ).
).
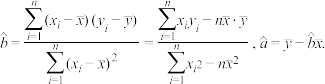
附:样本相关系数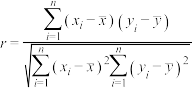 ,
, ,
, ,
, .
.
处的直径)越大,树就越高.由于测量树高比测量胸径困难,因此研究人员希望由胸径预测树高.在研究树高与胸径之间的关系时,某林场收集了某种树的一些数据:编号 |
|
|
|
|
|
|
|
|
|
|
|
|
|
|
|
|
胸径 |
|
|
|
|
|
|
|
|
|
|
|
|
|
|
|
|
树高 |
|
|
|
|
|
|
|
|
|
|
|
|
|
|
|
|


 ,,,,.
,,,,.(1)以胸径为横坐标,树高为纵坐标绘制散点图;
(2)求该林场这种树木的树高
(单位:)与胸径(单位:)的样本相关系数(精确到);(3)求该林场这种树木的树高
(单位:)关于胸径(单位:)的回归直线方程(精确到),并估计该林场这种树木的胸径为时的树高(精确到).附:样本相关系数
,,,.
您最近一年使用:0次
解题方法
2 . 某公司近5年产品研发年投资额(单位:百万元)与年销售量(单位:千件)的数据统计表如下:
(1)根据上表数据画出年投资额与年销售量的散点图; 作为年销售量关于年投资额的回归分析模型,并对年销售量取对数,得到如下数据表:
请根据表格数据、参考数据和公式,求出该非线性经验回归方程.
参考数据与公式: ;对于一组数据
 ,
, ,…,
,…, ,其经验回归直线
 的斜率和截距的最小二乘法估计公式分别为
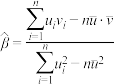 ,
, .
.
(单位:百万元)与年销售量(单位:千件)的数据统计表如下:年投资额 | 1 | 2 | 3 | 4 | 5 |
年销售量 | 0.5 | 1 | 1.5 | 3 | 5.5 |
与年销售量的散点图;
作为年销售量关于年投资额的回归分析模型,并对年销售量取对数,得到如下数据表:年销售量 | 0.5 | 1 | 1.5 | 3 | 5.5 |
|
| 0 | 0.4 | 1.1 | 1.7 |


参考数据与公式:
;对于一组数据,,…,,其经验回归直线的斜率和截距的最小二乘法估计公式分别为,.
您最近一年使用:0次
3 . 气象部门由每天的最高气温的数据,得到每月最高气温的平均数,简称平均高温.下表是2017年31个城市1月和7月的平均高温数据.
(1)画出并观察各城市 月与
月与 月的平均高温的散点图,你认为月与月的平均高温有线性趋势吗?描述散点图的特点.
(2)结合地理知识并用统计方法分析表中的数据,解释这两个月平均高温的关系.
城市 | 1月平均高温 | 7月平均高温 | 城市 | 1月平均高温 |
|
北京 | 3 | 32 | 南京 | 9 | 35 |
成都 | 12 | 32 | 南宁 | 20 | 33 |
重庆 | 12 | 36 | 上海 | 10 | 36 |
福州 | 17 | 36 | 沈阳 |
| 31 |
广州 | 21 | 33 | 石家庄 | 3 | 33 |
贵阳 | 9 | 28 | 太原 | 3 | 32 |
哈尔滨 |
| 30 | 天津 | 3 | 33 |
海口 | 22 | 32 | 乌鲁木齐 |
| 32 |
杭州 | 11 | 36 | 武汉 | 10 | 34 |
合肥 | 9 | 35 | 西安 | 8 | 36 |
呼和浩特 |
| 30 | 西宁 | 4 | 27 |
济南 | 6 | 33 | 银川 | 2 | 32 |
昆明 | 17 | 24 | 长春 |
| 29 |
拉萨 | 8 | 23 | 长沙 | 11 | 35 |
兰州 | 5 | 33 | 郑州 | 7 | 34 |
南昌 | 13 | 35 |


 月与月的平均高温的散点图,你认为月与月的平均高温有线性趋势吗?描述散点图的特点.
(2)结合地理知识并用统计方法分析表中的数据,解释这两个月平均高温的关系.
您最近一年使用:0次
2021-02-07更新
|
1251次组卷
|
4卷引用:人教A版(2019) 选择性必修第三册 新高考名师导学 第八章 复习参考题 8
解题方法
4 . 某校数学建模学生社团进行了一项实验研究,采集了 的一组数据如下表所示:
该社团对上述数据进行了分析,发现与之间具有线性相关关系.
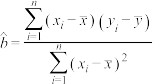
附:在线性回归方程 中,
中,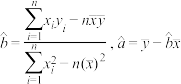 ,其中
,其中 为样本平均值.
(1)画出表中数据的散点图,并指出与之间的相关系数是正还是负;
(2)求出关于的线性回归方程,并写出当 时,预测数据的值.
的一组数据如下表所示:
| 2 | 3 | 4 | 5 | 6 | 7 |
| 52.5 | 45 | 40 | 30 | 25 | 17.5 |
与之间具有线性相关关系.附:在线性回归方程
中,,其中为样本平均值.(1)画出表中数据的散点图,并指出
与之间的相关系数是正还是负;(2)求出
关于的线性回归方程,并写出当时,预测数据的值.
您最近一年使用:0次
名校
解题方法
5 . 近年来,我国新能源汽车发展进入新阶段.某品牌 年到
年到 年新能源汽车年销量
 (万)如下表:其中年对应的年份代码
 为
为 .
.
(1)判断两个变量是否线性相关,并计算样本相关系数(精确到);
(2)(i)假设变量与变量 的
的 对观测数据为
 ,两个变量满足一元线性回归模型
 (随机误差
(随机误差 ),请写出参数
 的最小二乘估计;
(ii)令变量 ,则变量与变量满足一元线性回归模型,利用(i)中结论求关于的经验回归方程,并预测
 年该品牌新能源汽车的销售量.
附:样本相关系数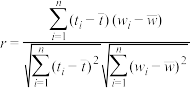 ,
, ,
, ,
, ,
,
年到年新能源汽车年销量(万)如下表:其中年对应的年份代码为.年份代码 | 1 | 2 | 3 | 4 | 5 |
销量 | 4 | 9 | 14 | 18 | 25 |
);(2)(i)假设变量
与变量的对观测数据为,两个变量满足一元线性回归模型(随机误差),请写出参数的最小二乘估计;(ii)令变量
,则变量与变量满足一元线性回归模型,利用(i)中结论求关于的经验回归方程,并预测年该品牌新能源汽车的销售量.附:样本相关系数
,,,,
您最近一年使用:0次
2023-06-03更新
|
399次组卷
|
2卷引用:陕西省西安市陕西师范大学附属中学2023-2024学年高二下学期期中考试数学试卷
解题方法
6 . 某车间为了规定工时定额,需要确定加工零件所花费的时间,为此作了四次试验,得到的数据如表:
 ,
,
(1)在给定的坐标系中画出表中数据的散点图;
(2)求出关于的线性回归方程 ;
;
(3)预测加工10个零件需要多少小时?
| 零件的个数x(个) | 2 | 3 | 4 | 5 |
| 加工的时间y(小时) | 2.5 | 3 | 4 | 4.5 |
,(1)在给定的坐标系中画出表中数据的散点图;
(2)求出
关于的线性回归方程;(3)预测加工10个零件需要多少小时?
您最近一年使用:0次
2023-12-11更新
|
350次组卷
|
3卷引用:新疆哈密市第八中学2021-2022学年高二上学期期末考试数学(文)试题
新疆哈密市第八中学2021-2022学年高二上学期期末考试数学(文)试题新疆哈密市第八中学2021-2022学年高二上学期期末数学(理)试题(已下线)专题05选择性必修三+选择性必修四期末考点汇总(12题型)-1
7 . 某同学在研究变量 之间的相关关系时,得到以下数据:并采用最小二乘法得到了线性回归方程
 ,则( )
,则( )
之间的相关关系时,得到以下数据:并采用最小二乘法得到了线性回归方程,则( ) | 4.8 | 5.8 | 7 | 8.3 | 9.1 |
| 2.8 | 4.1 | 7.2 | 9.1 | 11.8 |
A. | B. | C. | D. |
您最近一年使用:0次
2023-09-21更新
|
371次组卷
|
8卷引用:河南省南阳市第一中学校2022-2023学年高二下学期3月月考数学试题
河南省南阳市第一中学校2022-2023学年高二下学期3月月考数学试题(已下线)专题13 成对数据的统计分析(七大题型+过关检测专训)-2023-2024学年高二数学《重难点题型·高分突破》(人教A版2019选择性必修第三册)(已下线)第02讲 8.2 一元线性回归模型及其应用(知识清单+6类热点题型精讲+强化分层精练)-【帮课堂】2023-2024学年高二数学同步学与练(人教A版2019选择性必修第三册)(已下线)8.2 一元线性回归模型及其应用——课后作业(基础版)(已下线)第八章:成对数据的统计分析章末综合检测卷(新题型)-2023-2024学年高二数学题型分类归纳讲与练(人教A版2019选择性必修第三册)(已下线)8.2 一元线性回归模型及其应用(6大题型)精练-2023-2024学年高二数学题型分类归纳讲与练(人教A版2019选择性必修第三册)(已下线)第三节 成对数据的统计分析(第一课时)(核心考点集训)一轮复习点点通(已下线)模块一 专题3 统计讲2
名校
解题方法
8 . 为了研究某种细菌随时间x变化,繁殖的个数,收集数据如下:
(1)用天数作解释变量,繁殖个数作预报变量, 与y=
与y= 哪一个作为繁殖的个数y关于时间x变化的回归方程类型为最佳?(给出判断即可,不必说明理由)
其中 ;
;
(2)根据(1)的判断最佳结果及表中的数据,建立y关于x 的回归方程.
参考公式: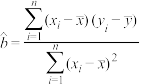 ,
,
| 天数x/天 | 1 | 2 | 3 | 4 | 5 | 6 |
| 繁殖个数y/个 | 6 | 12 | 25 | 49 | 95 | 190 |
与y=哪一个作为繁殖的个数y关于时间x变化的回归方程类型为最佳?(给出判断即可,不必说明理由) |  |  |  | 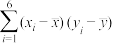 | 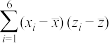 |
| 3.5 | 62.83 | 3.53 | 17.5 | 596.505 | 12.04 |
;(2)根据(1)的判断最佳结果及表中的数据,建立y关于x 的回归方程.
参考公式:
,
您最近一年使用:0次
2022-06-10更新
|
776次组卷
|
3卷引用:【全国百强校】江西省南昌市第二中学2017-2018学年高二下学期第二次月考数学(理)试题
【全国百强校】江西省南昌市第二中学2017-2018学年高二下学期第二次月考数学(理)试题江西省抚州市南城县第二中学2021-2022学年高二下学期第二次(月考)数学(理)试题(已下线)第04讲 拓展一:非线性经验回归方程 (精讲)
名校
9 . 某种产品的广告费用支出(万元)与销售额(万元)之间有如下的对应数据:
(1)作出销售额关于广告费用支出的散点图;
(2)求出关于的线性回归方程;
(3)据此估计估计广告费用为10万元时,销售收入的值.
参考公式: ,.
,.
(万元)与销售额(万元)之间有如下的对应数据:
| 2 | 4 | 5 | 6 | 8 |
| 30 | 40 | 60 | 50 | 70 |
关于广告费用支出的散点图;(2)求出
关于的线性回归方程; (3)据此估计估计广告费用为10万元时,销售收入的值.
参考公式:
,.
您最近一年使用:0次
2022-04-07更新
|
737次组卷
|
5卷引用:陕西省西安市阎良区关山中学2021-2022学年高二下学期第一次质量检测文科数学试题
名校
10 . 根据如下样本数据,得到回归直线方程为 ,则( )
,则( )
,则( )x | 4 | 5 | 6 | 7 | 8 | 9 |
y | 5.0 | 3.5 | 0.5 | 1.5 | -1.0 | -2.0 |
A. , , | B., |
C. , , | D., |
您最近一年使用:0次
2022-05-08更新
|
712次组卷
|
5卷引用:四川省雅安市2022-2023学年高二上学期期末考试数学(文)试题
四川省雅安市2022-2023学年高二上学期期末考试数学(文)试题四川省雅安市2022-2023学年高二上学期期末考试数学(理)试题四川省成都市石室中学2021-2022学年高三下学期第三次诊断性考试数学(理)试题四川省成都市石室中学2021-2022学年高三下学期“三诊模拟”文科数学试题(已下线)文科数学-2022年高考考前20天终极冲刺攻略(四)(5月31日)


