2018高一下·全国·专题练习
1 . 下列图形中表示两个变量具有线性相关关系的是
A.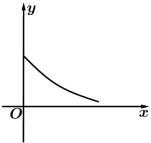 | B.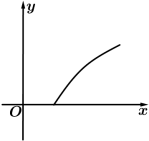 |
C.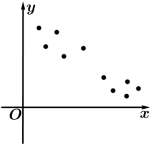 | D. |
您最近一年使用:0次
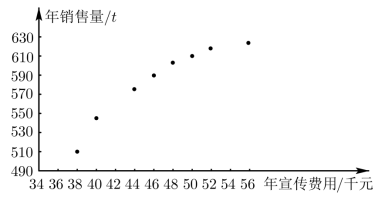
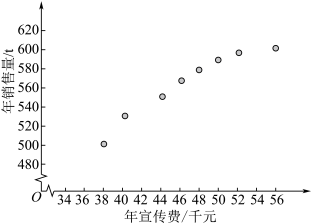
2 . 大连市某企业为确定下一年投入某种产品的宣传费,需了解年宣传费 (单位:千元)对年销售量
 (单位:
(单位: )和年利润
)和年利润 (单位:千元)的影响,对近8年的年宣传费
 和年销售量
和年销售量 数据作了初步处理,得到下面的散点图及一些统计量的值.
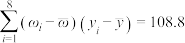
表中 ,
, .
.
(1)根据散点图判断, 与
与 哪一个适宜作为年销售量关于年宣传费的回归方程类型?(给出判断即可,不必说明理由)
(2)根据(1)的判断结果及表中数据,建立关于的回归方程;
(3)已知这种产品的年利润与、的关系为 . 根据(2)的结果回答下列问题:
(i)年宣传费 时,年销售量及年利润的预报值是多少?
(ii)年宣传费为何值时,年利润的预报值最大?
附:对于一组数据 ,其回归直线
 的斜率和截距的最小二乘估计分别为:
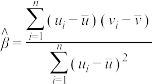 ,
, .
.
(单位:千元)对年销售量(单位:)和年利润(单位:千元)的影响,对近8年的年宣传费和年销售量数据作了初步处理,得到下面的散点图及一些统计量的值. |  |  |  |  |  |  |
| 46.6 | 573 | 6.8 | 289.8 | 1.6 | 215083.4 | 31280 |
,.(1)根据散点图判断,
与哪一个适宜作为年销售量关于年宣传费的回归方程类型?(给出判断即可,不必说明理由)(2)根据(1)的判断结果及表中数据,建立
关于的回归方程;(3)已知这种产品的年利润
与、的关系为. 根据(2)的结果回答下列问题:(i)年宣传费
时,年销售量及年利润的预报值是多少?(ii)年宣传费
为何值时,年利润的预报值最大?附:对于一组数据
,其回归直线的斜率和截距的最小二乘估计分别为:,.
您最近一年使用:0次
2018-04-12更新
|
662次组卷
|
2卷引用:辽宁省大连市2018届高三第一次模拟数学理试题
3 . 对于给定的两个变量的统计数据,下列说法正确的是__________ .(填序号)
①都可以分析出两个变量的关系;
②都可以用一条直线近似地表示两者的关系;
③都可以作出散点图;
④都可以用确定的表达式表示两者的关系.
①都可以分析出两个变量的关系;
②都可以用一条直线近似地表示两者的关系;
③都可以作出散点图;
④都可以用确定的表达式表示两者的关系.
您最近一年使用:0次
2018-04-06更新
|
553次组卷
|
8卷引用:河南省南阳市第一中学2017-2018学年高一下学期第一次月考数学试题
河南省南阳市第一中学2017-2018学年高一下学期第一次月考数学试题人教A版(2019) 选修第三册 过关斩将 第八章 8.1.1变量的相关关系+8.1.2样本相关系数沪教版(2020) 必修第三册 新课改一课一练 第13章 13.4.2茎叶图和散点图(已下线)9.1.1 变量的相关性(练习)-2022-2023学年高二数学同步精品课堂(苏教版2019选择性必修第二册)7.2.2成对数据的线性相关性 同步课时训练(已下线)9.1.1 变量的相关性-【题型分类归纳】2022-2023学年高二数学同步讲与练(苏教版2019选择性必修第二册)(已下线)8.1 成对数据的统计相关性——课堂例题(已下线)专题06 统计模型的热点题型(7类题型)-备战2023-2024学年高二数学下学期期末真题分类汇编(江苏专用)
4 . 在一次抽样调查中测得样本的5组数据,得到一个变量关于的回归方程模型,其对应的数值如下表:
(1)试作出散点图,根据散点图判断,与 哪一个适宜作为变量关于的回归方程模型?(给出判断即可,不必说明理由)
(2)根据(1)的判断结果及表中数据,建立变量关于的回归方程;
(3)根据(2)中所求的变量关于的回归方程预测:当 时,对应的值为多少?(保留四位有效数字)
关于的回归方程模型,其对应的数值如下表:
| 0.25 | 0.5 | 1 | 2 | 4 |
| 16 | 12 | 5 | 2 | 1 |
与哪一个适宜作为变量关于的回归方程模型?(给出判断即可,不必说明理由)(2)根据(1)的判断结果及表中数据,建立变量
关于的回归方程;(3)根据(2)中所求的变量
关于的回归方程预测:当时,对应的值为多少?(保留四位有效数字)
您最近一年使用:0次
5 . 与表格相比,能更直观地反映出相关数据总体状况的是( )
| A.列联表 | B.散点图 | C.残差图 | D.等高条形图 |
您最近一年使用:0次
名校
解题方法
6 . 某公司为确定下一年度投入某种产品的宣传费,需了解年宣传费(单位:千元)对年销售量(单位:)和年利润(单位:千元)的影响,对近 年的宣传费,和年销售量
 的数据作了初步处理,得到下面的散点图及一些统计量的值,表中
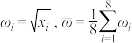 ,
, ,
, ,
, .
.
(1)根据散点图判断,与,哪一个宜作为年销售量关于年宣传费的回归方程类型(给出判断即可,不必说明理由);
(2)根据(1)的判断结果及表中数据,建立关于的回归方程;
(3)已知这种产品的年利润与,的关系为,根据(Ⅱ)的结果回答下列问题:
(i)当年宣传费 时,年销售量及年利润的预报值时多少?
(ii)当年宣传费为何值时,年利润的预报值最大?
参考公式: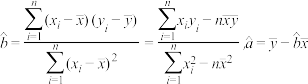
(单位:千元)对年销售量(单位:)和年利润(单位:千元)的影响,对近年的宣传费,和年销售量的数据作了初步处理,得到下面的散点图及一些统计量的值,表中,,,.(1)根据散点图判断,
与,哪一个宜作为年销售量关于年宣传费的回归方程类型(给出判断即可,不必说明理由);(2)根据(1)的判断结果及表中数据,建立
关于的回归方程;(3)已知这种产品的年利润
与,的关系为,根据(Ⅱ)的结果回答下列问题:(i)当年宣传费
时,年销售量及年利润的预报值时多少?(ii)当年宣传费
为何值时,年利润的预报值最大?参考公式:
您最近一年使用:0次
2018-02-28更新
|
516次组卷
|
2卷引用:高中数学人教A版选修2-3 综合复习与测试
名校
7 . 某公司为了研究年宣传费(单位:千元)对销售量(单位:吨)和年利润(单位:千元)的影响,搜集了近 8 年的年宣传费和年销售量 数据:
数据:
(1)请补齐表格中 8 组数据的散点图,并判断与中哪一个更适宜作为年销售量关于年宣传费的函数表达式?(给出判断即可,不必说明理由)

(2)若(1)中的 ,且产品的年利润与,的关系为
 ,为使年利润值最大,投入的年宣传费应为何值?
(单位:千元)对销售量(单位:吨)和年利润(单位:千元)的影响,搜集了近 8 年的年宣传费和年销售量数据: | 1 | 2 | 3 | 4 | 5 | 6 | 7 | 8 |
| 38 | 40 | 44 | 46 | 48 | 50 | 52 | 56 |
| 45 | 55 | 61 | 63 | 65 | 66 | 67 | 68 |
(1)请补齐表格中 8 组数据的散点图,并判断
与中哪一个更适宜作为年销售量关于年宣传费的函数表达式?(给出判断即可,不必说明理由)(2)若(1)中的
,且产品的年利润与,的关系为,为使年利润值最大,投入的年宣传费应为何值?
您最近一年使用:0次
2018-02-11更新
|
216次组卷
|
2卷引用:福建省泉州市2017-2018学年高一上学期期末考试数学试题
名校
8 . 已知,是两个变量,下列四个散点图中,,虽负相关趋势的是
,是两个变量,下列四个散点图中,,虽负相关趋势的是A. | B.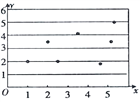 |
C. | D.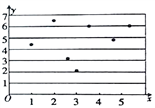 |
您最近一年使用:0次
2018-02-09更新
|
603次组卷
|
7卷引用:河北省邢台市2017-2018学年高一(上)期末测试数学试题
9 . 某中学的兴趣小组在某座山测得海拔高度、气压和沸点的六组数据绘制成散点图如图所示,则下列说法错误的是( )


| A.沸点与海拔高度呈正相关 | B.沸点与气压呈正相关 |
| C.沸点与海拔高度呈负相关 | D.沸点与海拔高度、沸点与气压的相关性都很强 |
您最近一年使用:0次
2018-02-07更新
|
360次组卷
|
3卷引用:四川省2017-2018年度高三“联测促改”活动理科数学试题
四川省2017-2018年度高三“联测促改”活动理科数学试题(已下线)2019年3月18日《每日一题》必修3 两个变量的线性相关与散点图沪教版(2020) 必修第三册 经典导学 课后作业 第13章 13.4 第2课时 茎叶图和散点图
名校
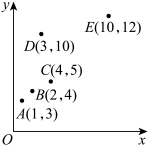
10 . 如图所示,有A,B,C,D,E,5组数据,去掉______ 组数据后,剩下的4组数据具有较强的线性相关关系.(请用
 作答)
作答)
作答)
您最近一年使用:0次
2018-01-28更新
|
480次组卷
|
11卷引用:人教A版高中数学必修三 第二章2.3.2两个变量的线性相关
人教A版高中数学必修三 第二章2.3.2两个变量的线性相关四川省遂宁市2017-2018学年高二上学期期末考试数学理试题四川省遂宁市2017-2018学年高二上学期期末考试数学文试题河北省武邑中学2017-2018学年高二上学期期末考试数学(理)试题(已下线)《周末培优君》2017-2018学年下学期高二文科数学——第01周 回归分析的基本思想及其初步应用四川省遂宁市2017-2018学年高二上学期教学水平监测数学(理)试题四川省遂宁市2017-2018学年高二上学期教学水平监测数学(文)试题人教B版(2019) 选择性必修第二册 过关斩将 第四章 概率与统计 4.3 统计模型 4.3.1 一元线性回归模型人教A版(2019) 选修第三册 实战演练 第八章 8.1 课时练习16 变量的相关关系(已下线)专题24 变量的相关性与线性回归方程(重点突围)-【学霸满分】2022-2023学年高二数学下学期重难点专题提优训练(苏教版2019选择性必修第二册)四川省射洪中学校2022-2023学年高二上学期1月月考数学(理)试题


