下表是关于某设备的使用年限x(年)和所需要的维修费用y(万元)的几组统计数据:
(1)请在给出的坐标系中画出上表数据的散点图;
(2)请根据上表提供的数据,用最小二乘法求出y关于x的线性回归方程 =
= x+
x+ ;
;
其中= ,=
,= -
- .
.
(3)若维修费用超过12万元时,设备停止使用,则设备最多使用几年?
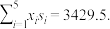
(参考数值:2×2.2+3×3.8+4×5.5+5×6.5+6×7.0=112.3)
| x | 2 | 3 | 4 | 5 | 6 |
| y | 2.2 | 3.8 | 5.5 | 6.5 | 7.0 |
(2)请根据上表提供的数据,用最小二乘法求出y关于x的线性回归方程
=x+;其中
=,=-.(3)若维修费用超过12万元时,设备停止使用,则设备最多使用几年?
(参考数值:2×2.2+3×3.8+4×5.5+5×6.5+6×7.0=112.3)
更新时间:2021-09-01 11:39:31
|
相似题推荐
解答题-作图题
|
较易
(0.85)
【推荐1】某个男孩的年龄与身高的统计数据如下表所示:
年龄x(岁) | 1 | 2 | 3 | 4 | 5 | 6 |
身高y(cm) | 78 | 87 | 98 | 108 | 115 | 120 |
(1)画出散点图;
(2)判断y与x是否具有线性相关关系,如果相关,是正相关还是负相关.
您最近一年使用:0次
解答题-作图题
|
较易
(0.85)
解题方法
【推荐2】为研究拉力 对弹簧长度
对弹簧长度 的影响,对不同拉力的6根弹簧进行测量,测得如下表中的数据:
(1)画出散点图;
(2)如果散点图中的各点大致分布在一条直线的附近,求Y关于X的线性回归方程.
对弹簧长度的影响,对不同拉力的6根弹簧进行测量,测得如下表中的数据:X | 5 | 10 | 15 | 20 | 25 | 30 |
Y | 7.25 | 8.12 | 8.95 | 9.9 | 10.9 | 11.8 |
(2)如果散点图中的各点大致分布在一条直线的附近,求Y关于X的线性回归方程.
您最近一年使用:0次
 .
. ,
, .
.
解答题-作图题
|
较易
(0.85)
解题方法
【推荐1】某班5名学生的数学和物理成绩如下:
(1)画出散点图,判断y与x之间是否具有相关关系;
(2)求物理成绩y关于数学成绩x的回归直线方程(结果保留两位小数);
(3)平均地看,该班某名同学的数学成绩是60分,那么物理成绩大约是多少分?
(参考公式: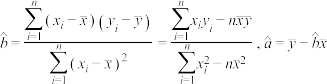 )
)
| 数学x(分) | 93 | 86 | 83 | 72 | 66 |
| 物理y(分) | 88 | 65 | 72 | 65 | 60 |
(2)求物理成绩y关于数学成绩x的回归直线方程(结果保留两位小数);
(3)平均地看,该班某名同学的数学成绩是60分,那么物理成绩大约是多少分?
(参考公式:
)
您最近一年使用:0次
解答题-作图题
|
较易
(0.85)
名校
解题方法
【推荐2】根据党的“扶贫同扶志、扶智相结合”精准扶贫、精准脱贫政策,中国儿童少年基金会为了丰富留守儿童的课余文化生活,培养良好的阅读习惯,在农村留守儿童聚居地区捐建“小候鸟爱心图书角”.2016年某村在寒假和暑假组织开展“小候鸟爱心图书角读书活动”,号召全村少年儿童积极读书,养成良好的阅读习惯,下表是对2016年以来近5年该村庄100位少年儿童的假期周人均读书时间的统计:
现要建立 关于
关于 的回归方程,有两个不同回归模型可以选择,模型一:
 ;模型二:
;模型二: ,即使画出关于的散点图,也无法确定哪个模型拟合效果更好,现用最小二乘法原理,已经求得模型一的方程为
 .
.
(1)请你用最小二乘法原理,结合下面的参考数据及参考公式求出模型二的方程(计算结果保留到小数点后一位);
(2)用计算残差平方和的方法比较哪个模型拟合效果更好,已经计算出模型一的残差平方和为 .
.
附:参考数据: ,其中
,其中 ,
, .
.
参考公式:对于一组数据 ,
, ,…,
,…, ,其回归直线
 的斜率和截距的最小二乘法估计公式分别为
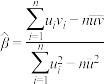 ,
, .
.
| 年份 | 2016 | 2017 | 2018 | 2019 | 2020 |
| 年份代码 | 1 | 2 | 3 | 4 | 5 |
| 每周人均读书时间(小时) | 1.3 | 2.8 | 5.7 | 8.9 | 13.8 |
关于的回归方程,有两个不同回归模型可以选择,模型一:;模型二:,即使画出关于的散点图,也无法确定哪个模型拟合效果更好,现用最小二乘法原理,已经求得模型一的方程为.(1)请你用最小二乘法原理,结合下面的参考数据及参考公式求出模型二的方程(计算结果保留到小数点后一位);
(2)用计算残差平方和的方法比较哪个模型拟合效果更好,已经计算出模型一的残差平方和为
.附:参考数据:
,其中,.参考公式:对于一组数据
,,…,,其回归直线的斜率和截距的最小二乘法估计公式分别为,.
您最近一年使用:0次
 个
个

 1
1
解答题-问答题
|
较易
(0.85)
名校
解题方法
【推荐1】在入室盗窃类案件中,出现频率最高的痕迹物证之一就是足迹. 负重行走对足迹步伐特征影响的规律强,而且较为稳定. 正在行走的人在负重的同时,步长变短,步宽变大,步角变大. 因此, 以身高分别为170cm, 175cm, 180cm的人员各 20名作为实验对象,让他们采取双手胸前持重物的负重方式行走,得到实验对象在负重0kg,5kg,10kg,15kg,20kg状态下相对稳定的步长数据平均值. 并在不同身高情况下,建立足迹步长s(单位:cm)关于负重x(单位:kg)的三个经验回归方程. 根据身高 170cm组数据建立线性回归方程①: 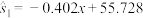 ;根据身高 175cm组数据建立线性回归方程②:
  根据身高 180cm 组数据建立线性回归方程③:
  .
.
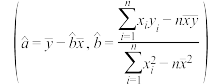
(1)根据身高 180cm组的统计数据,求 ,的值,并解释参数的含义;
(2)在一起盗窃案中,被盗窃物品重为9kg,在现场勘查过程中,测量得犯罪嫌疑人往返时足迹步长的差值为4.464cm,推测该名嫌疑人的身高,并说明理由.
附: .为回归方程,
  ,
, ,
, ,
,
;根据身高 175cm组数据建立线性回归方程②: 根据身高 180cm 组数据建立线性回归方程③: .(1)根据身高 180cm组的统计数据,求
,的值,并解释参数的含义;| 身高 180cm不同负重情况下的步长数据平均值 | |||||
| 负重x/kg | 0 | 5 | 10 | 15 | 20 |
| 足迹步长s/cm | 74.35 | 73.50 | 71.80 | 68.60 | 65.75 |
(2)在一起盗窃案中,被盗窃物品重为9kg,在现场勘查过程中,测量得犯罪嫌疑人往返时足迹步长的差值为4.464cm,推测该名嫌疑人的身高,并说明理由.
附:
.为回归方程, ,,,
您最近一年使用:0次
解答题-应用题
|
较易
(0.85)
解题方法
【推荐2】某公司拟对某种材料进行应用改造,产品的成本由原料成本及非原料成本组成,每件产品的非原料成本(元)与生产该产品的数量(千件)有关,经统计得到如下数据:
对历史数据对比分析,考虑用函数模型① ,②
,② 分别对两个变量的关系进行拟合,令模型①中
 上,模型②中
 ,对数据作了初步处理,已计算得到如下数据:
(1)设 和的样本相关系数为
 ,和
,和 的样本相关系数为
 ,已经计算得出
 ,请从样本相关系数(精确到0.01)的角度判断,哪个模型拟合效果更好?
(2)根据(1)的选择及表中数据,建立关于的非线性回归方程,并用其估计当每件产品的非原料成本为21元时,产量约为多少千件?
参考公式:对于一组数据 ,
, ,…,
,…, 其回归直线
其回归直线 的斜率和截距的最小二乘估计分别为:
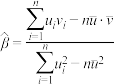 ,
, ,相关系数
,相关系数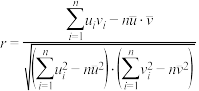 .
.
(元)与生产该产品的数量(千件)有关,经统计得到如下数据: | 1 | 2 | 3 | 4 | 5 | 6 | 7 | 8 |
| 112 | 61 | 44.5 | 35 | 30.5 | 28 | 25 | 24 |
,②分别对两个变量的关系进行拟合,令模型①中上,模型②中,对数据作了初步处理,已计算得到如下数据: |  |  |  |  |  |  |  |
| 0.34 | 45 | 0.115 | 22385.5 | 1.53 | 183.4 | 61.4 | 0.135 |
和的样本相关系数为,和的样本相关系数为,已经计算得出,请从样本相关系数(精确到0.01)的角度判断,哪个模型拟合效果更好?(2)根据(1)的选择及表中数据,建立
关于的非线性回归方程,并用其估计当每件产品的非原料成本为21元时,产量约为多少千件?参考公式:对于一组数据
,,…,其回归直线的斜率和截距的最小二乘估计分别为:,,相关系数.
您最近一年使用:0次
解答题-问答题
|
较易
(0.85)
解题方法
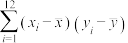
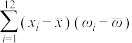
【推荐3】为了解某地区未成年男性身高与体重的关系,对该地区12组不同身高 (单位:cm)的未成年男性体重的平均值
 (单位:kg)(
 )数据作了初步处理,得到下面的散点图和一些统计量的值.

表中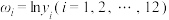 ,
, .
.
(1)根据散点图判断 和
和 哪一个适宜作为该地区未成年男性体重的平均值与身高的回归方程类型?(给出判断即可,不必说明理由).
(2)根据(1)的判断结果及表中数据,建立关于的回归方程;
(3)如果体重高于相同身高的未成年男性平均值的1.2倍为偏胖,低于0.8倍为偏瘦,那么该地区的一位未成年男性身高为 ,体重为
,体重为 ,他的体重是否正常?
附:对于一组数据,,……,,其回归直线 的斜率和截距的最小二乘估计分别为
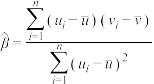 ,
, ,
, .
.
(单位:cm)的未成年男性体重的平均值(单位:kg)()数据作了初步处理,得到下面的散点图和一些统计量的值.
|
|
|
|
|
|
115 | 24.358 | 2.958 | 14300 | 6300 | 286 |


 ,.
,.(1)根据散点图判断
和哪一个适宜作为该地区未成年男性体重的平均值与身高的回归方程类型?(给出判断即可,不必说明理由).(2)根据(1)的判断结果及表中数据,建立
关于的回归方程;(3)如果体重高于相同身高的未成年男性平均值的1.2倍为偏胖,低于0.8倍为偏瘦,那么该地区的一位未成年男性身高为
,体重为,他的体重是否正常?附:对于一组数据
,,……,,其回归直线的斜率和截距的最小二乘估计分别为,,.
您最近一年使用:0次


