由于疫情得到有效控制,某便民小超市的销售状况明显好转,在2021年7月份至11月份的收入情况如下表.
并计算得 ,
, ,
, ,
, ,
, ,
,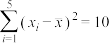 ,
, .
.
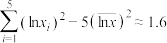
(1)建立y关于x的回归直线方程 (结果保留2位小数),
(2)预测该商场12月份的收入情况.(结果保留1位小数).
附: ,
, .
.
月份x | 7 | 8 | 9 | 10 | 11 | 12 |
收入y(万元) | 1.6 | 1.5 | 1.7 | 1.8 | 2.0 | m |
,,,,,,.(1)建立y关于x的回归直线方程
(结果保留2位小数),(2)预测该商场12月份的收入情况.(结果保留1位小数).
附:
,.
更新时间:2022-01-24 23:39:04
|
相似题推荐
解答题-问答题
|
适中
(0.65)
名校
解题方法
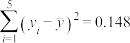
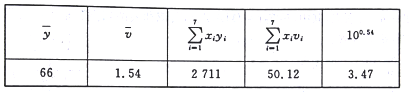
【推荐1】抗体药物的研发是生物技术制药领域的一个重要组成部分,抗体药物的摄入量与体内抗体数量的关系成为研究抗体药物的一个重要方面.某研究团队收集了10组抗体药物的摄入量与体内抗体数量的数据,并对这些数据作了初步处理,得到了如图所示的散点图及一些统计量的值,抗体药物摄入量为x(单位: ),体内抗体数量为y(单位:
 ).
).
 作为体内抗体数量y关于抗体药物摄入量x的回归方程,将两边取对数,得
 ,可以看出
,可以看出 与
与 具有线性相关关系,试根据参考数据建立
 关于
关于 的回归方程,并预测抗体药物摄入量为
 时,体内抗体数量的值;
(2)经技术改造后,该抗体药物的有效率z大幅提高,经试验统计得z服从正态分布 ,那这种抗体药物的有效率
 超过0.54的概率约为多少?
附:①对于一组数据 ,其回归直线
 的斜率和截距的最小二乘估计分别为
 ,
, ;
;
②若随机变量 ,则有
,则有 ,
, ,
, ;
;
③取 .
.
),体内抗体数量为y(单位:).
|
|
|
|
29.2 | 12 | 16 | 34.4 |


作为体内抗体数量y关于抗体药物摄入量x的回归方程,将两边取对数,得,可以看出与具有线性相关关系,试根据参考数据建立关于的回归方程,并预测抗体药物摄入量为时,体内抗体数量的值;(2)经技术改造后,该抗体药物的有效率z大幅提高,经试验统计得z服从正态分布
,那这种抗体药物的有效率超过0.54的概率约为多少?附:①对于一组数据
,其回归直线的斜率和截距的最小二乘估计分别为,;②若随机变量
,则有,,;③取
.
您最近一年使用:0次
解答题-问答题
|
适中
(0.65)
名校
解题方法
【推荐2】近年来,随着国家综合国力的提升和科技的进步,截至 年底,中国铁路运营里程达
 万千米,这个数字比
 年增长了
年增长了 倍;高铁运营里程突破
 万千米,占世界高铁运营里程的
 以上,居世界第一位.如表截取了
 年中国高铁密度的发展情况(单位:千米/万平方千米).
已知高铁密度与年份代码之间满足关系式 (
( 为大于
为大于 的常数).
的常数).
(1)根据所给数据,求关于的回归方程(精确到 位);
位);
(2)利用(1)的结论,预测到哪一年,高铁密度会超过 千米/万平方千米.
参考公式:设具有线性相关系的两个变量 的一组数据为
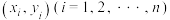 ,则回归方程的系数:
 ,
,
参考数据: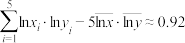 ,
, ,
, ,
, ,
, ,
, .
.
年底,中国铁路运营里程达万千米,这个数字比年增长了倍;高铁运营里程突破万千米,占世界高铁运营里程的以上,居世界第一位.如表截取了年中国高铁密度的发展情况(单位:千米/万平方千米).| 年份 |  |  |  |  |  |
| 年份代码 |  |  |  |  | |
| 高铁密度 |  |  |  |  |  |
已知高铁密度
与年份代码之间满足关系式(为大于的常数).(1)根据所给数据,求
关于的回归方程(精确到位);(2)利用(1)的结论,预测到哪一年,高铁密度会超过
千米/万平方千米.参考公式:设具有线性相关系的两个变量
的一组数据为,则回归方程的系数:,参考数据:
,,,,,.
您最近一年使用:0次
解答题-问答题
|
适中
(0.65)
解题方法
【推荐3】最近青少年的视力健康问题引起习主席的高度重视,某地区为了解当地24所小学,24所初中和12所高中的学生的视力状况,准备采用分层抽样的方法从这些学校中随机抽取5所学校对学生进行视力调查.
(1)若从所抽取的5所学校中再随机抽取3所学校进行问卷调查,求抽到的这3所学校中,小学、初中、高中分别有一所的概率;
(2)若某小学被抽中,调查得到了该小学前五个年级近视率y的数据如下表:
根据前五个年级的数据,利用最小二乘法求出y关于x的线性回归方程,并根据方程预测六年级学生的近视率.
附:回归直线 的斜率和截距的最小二乘法,估计公式分别为
 ,
,
参考数据: ,
, .
.
(1)若从所抽取的5所学校中再随机抽取3所学校进行问卷调查,求抽到的这3所学校中,小学、初中、高中分别有一所的概率;
(2)若某小学被抽中,调查得到了该小学前五个年级近视率y的数据如下表:
年级号x | 1 | 2 | 3 | 4 | 5 |
近视率y | 0.05 | 0.09 | 0.16 | 0.20 | 0.25 |
附:回归直线
的斜率和截距的最小二乘法,估计公式分别为,参考数据:
,.
您最近一年使用:0次
解答题-问答题
|
适中
(0.65)
名校
解题方法
【推荐1】某科技公司积极响应,加大高科技研发投入,现对近十年来高科技研发投入情况分析调研,统计了近十年的研发投入(单位:亿元)与年份代码共10组数据,其中年份代码 ,2,…,10分别指2013年,2014年,…,2022年.现用模型①
 ,②
,② 分别进行拟合,由此得到相应的回归方程,并进行残差分析,得到下图所示的残差图.
 ,
, .
.
(1)根据残差图,比较模型①②的拟合效果,应选择哪个模型?并说明理由;
(2)根据①中所选模型,求出关于的回归方程;根据该模型,求该公司2028年高科技研发投入的预报值.(回归系数精确到0.01)
附:对于一组具有线性相关关系的数据 ,
, ,
, ,
, ,其回归直线
 的斜率和截距的最小二乘估计分别为
 ,.
,.
(单位:亿元)与年份代码共10组数据,其中年份代码,2,…,10分别指2013年,2014年,…,2022年.现用模型①,②分别进行拟合,由此得到相应的回归方程,并进行残差分析,得到下图所示的残差图.
,.
|
|
|
|
|
|
75 | 2.25 | 82.5 | 4.5 | 121.4 | 28.82 |


(2)根据①中所选模型,求出
关于的回归方程;根据该模型,求该公司2028年高科技研发投入的预报值.(回归系数精确到0.01)附:对于一组具有线性相关关系的数据
,,,,其回归直线的斜率和截距的最小二乘估计分别为,.
您最近一年使用:0次
解答题-问答题
|
适中
(0.65)
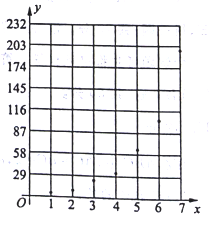
【推荐2】近期济南公交公司分别推出支付宝和微信扫码支付乘车活动,活动设置了一段时间的推广期,由于推广期内优惠力度较大,吸引越来越多的人开始使用扫码支付.某线路公交车队统计了活动刚推出一周内每一天使用扫码支付的人次,用表示活动推出的天数, 表示每天使用扫码支付的人次(单位:十人次),统计数据如表所示:

根据以上数据,绘制了散点图.
(1)根据散点图判断,在推广期内, 与
与 (
( 均为大于零的常数)哪一个适宜作为扫码支付的人次关于活动推出天数的回归方程类型?(给出判断即可,不必说明理由);
(2)根据(1)的判断结果及表中的数据,建立关于的回归方程,并预测活动推出第 天使用扫码支付的 人次;
(3)推广期结束后,为更好的服务乘客,车队随机调查了 人次的乘车支付方式,得到如下结果:
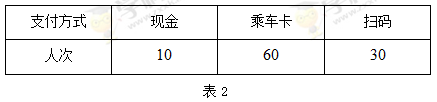
已知该线路公交车票价元,使用现金支付的乘客无优惠,使用乘车卡支付的乘客享受折优惠,扫码支付的乘客随机优惠,根据调查结果发现:使用扫码支付的乘客中有名乘客享受 折优惠,有
折优惠,有 名乘客享受折优惠,有
 名乘客享受
名乘客享受 折优惠.预计该车队每辆车每个月有1万人次乘车,根据所给数据,以事件发生的频率作为相应事件发生的概率,在不考虑其他因素的条件下,按照上述收费标准,试估计该车队一辆车一年的总收入.
参考数据:
其中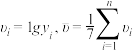
参考公式:
对于一组数据 ,其回归直线
 的斜率和截距的最小二乘估计公式分别为:

表示活动推出的天数, 表示每天使用扫码支付的人次(单位:十人次),统计数据如表所示:根据以上数据,绘制了散点图.
(1)根据散点图判断,在推广期内,
与(均为大于零的常数)哪一个适宜作为扫码支付的人次关于活动推出天数的回归方程类型?(给出判断即可,不必说明理由);(2)根据(1)的判断结果及表
中的数据,建立关于的回归方程,并预测活动推出第天使用扫码支付的 人次;(3)推广期结束后,为更好的服务乘客,车队随机调查了
人次的乘车支付方式,得到如下结果:已知该线路公交车票价
元,使用现金支付的乘客无优惠,使用乘车卡支付的乘客享受折优惠,扫码支付的乘客随机优惠,根据调查结果发现:使用扫码支付的乘客中有名乘客享受折优惠,有名乘客享受折优惠,有名乘客享受折优惠.预计该车队每辆车每个月有1万人次乘车,根据所给数据,以事件发生的频率作为相应事件发生的概率,在不考虑其他因素的条件下,按照上述收费标准,试估计该车队一辆车一年的总收入.参考数据:
其中
参考公式:
对于一组数据
,其回归直线的斜率和截距的最小二乘估计公式分别为:
您最近一年使用:0次
解答题-应用题
|
适中
(0.65)
【推荐3】2021年东京奥运会,中国举重代表队共10人,其中主教练、教练各1人,参赛选手8人,赛后结果7金1银,在全世界面前展现了真正的中国力量;举重比赛根据体重进行分级,某次举重比赛中,男子举重按运动员体重分为下列十级:
每个级别的比赛分为抓举与挺举两个部分,最后综合两部分的成绩得出总成绩,所举重量最大者获胜,在该次举重比赛中,获得金牌的运动员的体重以及举重成绩如下表
(1)根据表中的数据,求出运动员举重成绩与运动员的体重的回归直线方程(保留1位小数);
(2)某金牌运动员抓举成绩为180公斤,挺举成绩为218公斤,则该运动员最有可能是参加的哪个级别的举重?
(3)凯旋回国后,中央一台记者从团队的10人中随机抽取3人进行访谈,用 表示抽取到的是金牌得主的人数,求的概率分布列与数学期望.
参考数据: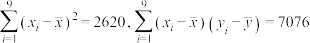 ;
;
参考公式: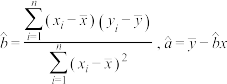 .
.
| 级别 | 54公斤级 | 59公斤级 | 64公斤级 | 70公斤级 | 76公斤级 |
| 体重 |  |  |  |  |  |
| 级别 | 83公斤级 | 91公斤级 | 99公斤级 | 108公斤级 | 108公斤级以上 |
| 体重 |  |  |  |  |  |
| 体重 | 54 | 59 | 64 | 70 | 76 | 83 | 91 | 99 | 106 |
| 举重成绩 | 291 | 304 | 337 | 353 | 363 | 389 | 406 | 421 | 430 |
与运动员的体重的回归直线方程(保留1位小数);(2)某金牌运动员抓举成绩为180公斤,挺举成绩为218公斤,则该运动员最有可能是参加的哪个级别的举重?
(3)凯旋回国后,中央一台记者从团队的10人中随机抽取3人进行访谈,用
表示抽取到的是金牌得主的人数,求的概率分布列与数学期望.参考数据:
;参考公式:
.
您最近一年使用:0次


