1 . 若变量 ,
, 有如下观察的数据:
(1)画出散点图;
(2)判断变量 ,
, 是否具有相关关系?如果具有相关关系,那么是正相关还是负相关?
,有如下观察的数据:
| 151 | 152 | 153 | 154 | 156 | 157 | 158 | 159 | 160 | 162 | 163 | 164 |
| 40 | 41 | 41 | 41.5 | 42 | 42.5 | 43 | 44 | 45 | 45 | 46 | 45.5 |
(2)判断变量
,是否具有相关关系?如果具有相关关系,那么是正相关还是负相关?
您最近一年使用:0次
解题方法
2 . 随着智能手机的普及,使用手机上网成为了人们日常生活的一部分,很多消费者对手机流量的需求越来越大,某通信公司为了更好地满足消费者对流量的需求,准备推出一款流量包该通信公司选了5个城市(总人数、经济发展情况、消费能力等方面比较接近)采用不同的定价方案作为试点,经过一个月的统计,发现该流量包的定价(单位:元/月)和购买人数(单位:万人)的关系如下表:
(1)根据表中的数据,运用相关系数进行分析说明,是否可以用线性回归模型拟合与的关系?并指出与是正相关还是负相关.
(2)①求出关于的回归方程;
②若该通信公司在一个类似于试点的城市中将这款流量包的价格定为25元/月,请用所求回归方程预测该市一个月内购买该流量包的人数能否超过20万人.
参考数据: ,
, ,
, .
.
(单位:元/月)和购买人数(单位:万人)的关系如下表:x | 30 | 35 | 40 | 45 | 50 |
y | 18 | 14 | 10 | 8 | 5 |
与的关系?并指出与是正相关还是负相关.(2)①求出
关于的回归方程;②若该通信公司在一个类似于试点的城市中将这款流量包的价格定为25元/月,请用所求回归方程预测该市一个月内购买该流量包的人数能否超过20万人.
参考数据:
,,.
您最近一年使用:0次
3 . 某超市为了解气温对某产品销售量的影响,随机记录了该超市12月份中 天的日销售量(单位:千克)与该地当日最低气温(单位:
 )的数据,如下表所示:
 求关于的线性回归方程
 ;(精确到
;(精确到 )
)
 判断与之间是正相关还是负相关;若该地12月份某天的最低气温为
 ,请用中的回归方程预测该超市当日的销售量.
参考公式: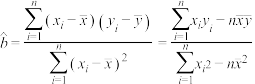 ,
,
参考数据: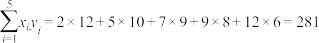 ,
,
天的日销售量(单位:千克)与该地当日最低气温(单位:)的数据,如下表所示: |  | |  |  |  |
| |  | |  |  |
求关于的线性回归方程;(精确到)判断与之间是正相关还是负相关;若该地12月份某天的最低气温为,请用中的回归方程预测该超市当日的销售量.参考公式:
,参考数据:
,
您最近一年使用:0次
2019-09-19更新
|
639次组卷
|
3卷引用:广东省潮州市2018-2019学年高二下学期期末教学质量检测数学(文)试题
广东省潮州市2018-2019学年高二下学期期末教学质量检测数学(文)试题广东省潮州市2018-2019学年高二下学期期末教学质量检测数学(理)试题(已下线)8.1.1 变量的相关关系(分层作业)-【上好课】高二数学同步备课系列(人教A版2019选择性必修第三册)
解题方法
4 . 如果某位同学10次考试的物理成绩y与数学成绩x如下表所示.
已知y与x线性相关:
(1)判断正相关还是负相关;
(2)求出y关于x的回归直线方程;
(3)该同学的数学成绩每提高3分,物理成绩估计能提高多少分?
| 数学成绩x | 76 | 82 | 72 | 87 | 93 | 78 | 89 | 66 | 81 | 76 |
| 物理成绩y | 80 | 87 | 75 | 86 | 100 | 79 | 93 | 68 | 85 | 77 |
(1)判断正相关还是负相关;
(2)求出y关于x的回归直线方程;
(3)该同学的数学成绩每提高3分,物理成绩估计能提高多少分?
您最近一年使用:0次
解题方法
5 . 若关于某设备的使用年限x(年)和所支出的维修费y(万元)有如下统计资料:
若由资料知,y对x呈线性相关关系.
(1)请根据上表提供的数据,用最小二乘法求出关于的线性回归方程
 ;
;
(2)y对x呈正相关还是负相关?
(3)估计使用年限为10年时,试求维修费用约是多少?(精确到两位小数)
| x | 2 | 3 | 4 | 5 | 6 |
| y | 2.2 | 3.8 | 5.5 | 6.5 | 7.0 |
(1)请根据上表提供的数据,用最小二乘法求出
关于的线性回归方程;(2)y对x呈正相关还是负相关?
(3)估计使用年限为10年时,试求维修费用约是多少?(精确到两位小数)
您最近一年使用:0次
名校
解题方法
6 . 某商店为了解气温对某产品销售量的影响,随机记录了该商店3月份中5天的日销售量 单位:千克
单位:千克 与该地当日最低气温
 单位:
单位: 的数据,如表所示:
(1)求y与x的回归方程 ;
;
(2)判断y与x之间是正相关还是负相关;若该地3月份某天的最低气温为,请用(1)中的回归方程预测该商店当日的销售量.
参考公式: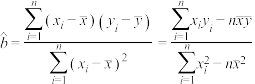 ,
, .
.
单位:千克与该地当日最低气温单位:的数据,如表所示:x | 2 | 5 | 8 | 9 | 11 |
y | 12 | 10 | 8 | 8 | 7 |
;(2)判断y与x之间是正相关还是负相关;若该地3月份某天的最低气温为
,请用(1)中的回归方程预测该商店当日的销售量.参考公式:
,.
您最近一年使用:0次
名校
解题方法
7 . 由某种设备的使用年限 (年)与所支出的维修费
 (万元)的数据资料算得结果,
  ,
, ,
, ,
, .
.
(1)求所支出的维修费对使用年限 的线性回归方程;
(2)①判断变量与之间是正相关还是负相关;
②当使用年限为8年时,试估计支出的维修费是多少.
(附:在线性回归方程中, 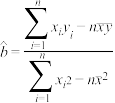 ,,其中
,,其中 为样本平均值.)
(年)与所支出的维修费 (万元)的数据资料算得结果, ,,,.(1)求所支出的维修费
对使用年限的线性回归方程;(2)①判断变量
与之间是正相关还是负相关;②当使用年限为8年时,试估计支出的维修费是多少.
(附:在线性回归方程
中, ,,其中为样本平均值.)
您最近一年使用:0次
21-22高二·全国·课后作业
8 . 5名学生的数学和物理成绩如下表,画出散点图,并判断它们是否具有相关关系.

您最近一年使用:0次
2019高二·全国·专题练习
9 . 根据变量,的观测数据可得散点图(1);根据变量 ,
, 的观测数据可得散点图(2).由这两个散点图判断与,与之间的相关关系类型(即指出是正相关还是负相关).
,的观测数据可得散点图(1);根据变量,的观测数据可得散点图(2).由这两个散点图判断与,与之间的相关关系类型(即指出是正相关还是负相关).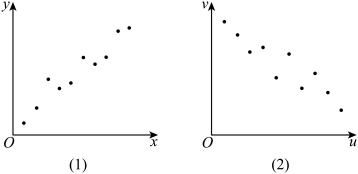
您最近一年使用:0次
2019高二·全国·专题练习
10 . 据报道:“一项在上海市9000多名中小学生中进行的调查显示,肥胖指数和学业成绩呈明显的负相关.”依据这个结论,越肥胖的孩子学习成绩越有可能不好,对吗?
您最近一年使用:0次
2019-02-18更新
|
309次组卷
|
4卷引用:高中数学新教材练习题
(已下线)高中数学新教材练习题(已下线)第四章 概率与统计 4.3 统计模型 4.3.1 一元线性回归模型人教B版(2019)选择性必修第二册课本习题4.3.1 一元线性回归模型8.1.1变量的相关关系练习


