解题方法
1 . 某民营学校为增强实力与影响力,大力招揽名师、建设校园硬件设施,近5年该校招生人数的数据如下表:
(1)由表中数据可看出,可用线性回归模型拟合 与
与 的关系,请用相关系数加以证明;
(2)求关于的回归直线方程,并预测当年份序号为7时该校的招生人数.
参考数据: ,
, ,
, .
.
参考公式:相关系数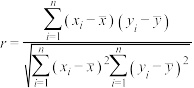 ,回归方程
,回归方程 中斜率和截距的最小二乘估计公式分别为
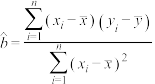 ,
, .
.
年份序号x | 1 | 2 | 3 | 4 | 5 |
招生人数y/千人 | 0.8 | 1 | 1.3 | 1.7 | 2.2 |
与的关系,请用相关系数加以证明;(2)求
关于的回归直线方程,并预测当年份序号为7时该校的招生人数.参考数据:
,,.参考公式:相关系数
,回归方程中斜率和截距的最小二乘估计公式分别为,.
您最近一年使用:0次
2024-03-21更新
|
925次组卷
|
4卷引用:河北省邯郸市2024届高三第三次调研考试考试数学试题
河北省邯郸市2024届高三第三次调研考试考试数学试题河南省南阳市华龙高级中学2023-2024学年高二下学期3月月考数学试题(已下线)专题8.5 成对数据的统计分析全章十一大基础题型归纳(基础篇)-2023-2024学年高二数学举一反三系列(人教A版2019选择性必修第三册)(已下线)专题8.4 统计分析大题专项训练【六大题型】-2023-2024学年高二数学举一反三系列(人教A版2019选择性必修第三册)
解题方法
2 . 航班正点率是指航空旅客运输部门在执行运输计划时,航班实际出发时间与计划出发时间较为一致的航班数量与全部航班数量的比率.人们常用航班正点率来衡量一个航空公司的运行效率和服务质量.现随机抽取10家航空公司,对其近一年的航班正点率和顾客投诉次数进行调查,得到数据如下:
整理数据得: ,
, ,
, ,
, ,
, ,
, .
.
(1)(i)证明:样本相关系数 ;
;
(ii)根据以上数据计算样本相关系数(结果保留2位小数),并由此推断顾客投诉次数与航班正点率之间的线性相关程度(若 ,则认为线性相关程度很强;若
 ,则认为线性相关程度一般;若
 ,则认为线性相关程度很弱).
(2)用一元线性回归模型对上表中的样本数据进行拟合,得到顾客投诉次数关于航班正点率的经验回归方程为 .现有一家航空公司拟通过加强内部管理来减少由于公司自身原因引起的航班延误次数,并希望一年内收到的顾客投诉不超过73次,试估计该公司的航班正点率应达到多少?
参考公式:样本相关系数 .
.
航空公司编号 | 1 | 2 | 3 | 4 | 5 | 6 | 7 | 8 | 9 | 10 |
航班正点率 | 82 | 77 | 77 | 76 | 74 | 73 | 71 | 70 | 91 | 69 |
顾客投诉次数 | 21 | 58 | 79 | 68 | 74 | 93 | 72 | 122 | 18 | 125 |
,,,,,.(1)(i)证明:样本相关系数
;(ii)根据以上数据计算样本相关系数(结果保留2位小数),并由此推断顾客投诉次数与航班正点率之间的线性相关程度(若
,则认为线性相关程度很强;若,则认为线性相关程度一般;若,则认为线性相关程度很弱).(2)用一元线性回归模型对上表中的样本数据进行拟合,得到顾客投诉次数关于航班正点率的经验回归方程为
.现有一家航空公司拟通过加强内部管理来减少由于公司自身原因引起的航班延误次数,并希望一年内收到的顾客投诉不超过73次,试估计该公司的航班正点率应达到多少?参考公式:样本相关系数
.
您最近一年使用:0次
解题方法
3 . 安顺市教育局为深入贯彻党的教育方针,全面落实《中共中央国务院关于全面加强新时代大中小学劳动教育的意见》,从2022年起,安顺市中小学积极推进劳动教育课程改革,某高中积极响应教育局安排,先后开发开设了具有安顺特色的烹饪、手工、园艺、职业体验、非物质文化遗产等劳动实践类校本课程,为调研学生对新开设劳动课程的满意度并不断改进劳动教育,该校从2022年1月到10月每两个月从全校3000名学生中随机抽取150名学生进行问卷调查,统计数据如下表:
(1)由表中看出,满意人数与月份之间存在很强的线性正相关关系,请用相关系数 加以证明(一般认为
 时有很强的线性相关关系);并求关于的经验回归方程
 ,请用该方程预测12月份该校全体学生中对劳动课程的满意人数;
(2)10月份时,该校为进一步深化劳动教育改革,了解不同性别的学生对劳动课程是否满意,经调研得如下统计表:
请根据 的独立性检验,能否认为该校的学生性别与对劳动课程是否满意有关联?
参考公式: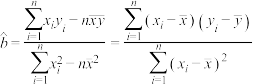 ,
, ;
;
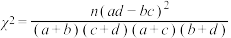 ,其中
,其中 ,
, ,
, .
.
| 月份 | 2 | 4 | 6 | 8 | 10 |
| 满意人数 | 80 | 95 | 100 | 105 | 120 |
与月份之间存在很强的线性正相关关系,请用相关系数加以证明(一般认为时有很强的线性相关关系);并求关于的经验回归方程,请用该方程预测12月份该校全体学生中对劳动课程的满意人数;(2)10月份时,该校为进一步深化劳动教育改革,了解不同性别的学生对劳动课程是否满意,经调研得如下统计表:
| 满意 | 不满意 | 合计 | |
| 男生 | 65 | 10 | 75 |
| 女生 | 55 | 20 | 75 |
| 合计 | 120 | 30 | 150 |
的独立性检验,能否认为该校的学生性别与对劳动课程是否满意有关联?参考公式:
,; | 0.10 | 0.05 | 0.025 | 0.010 | 0.005 |
 | 2.706 | 3.841 | 5.024 | 6.635 | 7.879 |
,其中,,.
您最近一年使用:0次
名校
4 . 某校20名学生的数学成绩 和知识竞赛成绩
 如下表:
如下表:
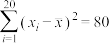
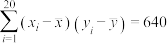
计算可得数学成绩的平均值是 ,知识竞赛成绩的平均值是
 ,并且
,并且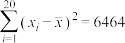 ,
, ,
, .
.
(1)求这组学生的数学成绩和知识竞赛成绩的样本相关系数(精确到0.01);
(2)设 ,变量和变量的一组样本数据为
 ,其中
,其中 两两不相同,
 两两不相同.记
 在
在 中的排名是第
 位,
位, 在
在 中的排名是第
 位,
位, .定义变量和变量的“斯皮尔曼相关系数”(记为
 )为变量的排名和变量的排名的样本相关系数.
(i)记 ,.证明:
,.证明: ;
;
(ii)用(i)的公式求得这组学生的数学成绩和知识竞赛成绩的“斯皮尔曼相关系数”约为0.91,简述“斯皮尔曼相关系数”在分析线性相关性时的优势.
注:参考公式与参考数据.
 ;
; ;
; .
.
和知识竞赛成绩如下表:| 学生编号i | 1 | 2 | 3 | 4 | 5 | 6 | 7 | 8 | 9 | 10 |
| 数学成绩 | 100 | 99 | 96 | 93 | 90 | 88 | 85 | 83 | 80 | 77 |
| 知识竞赛成绩 | 290 | 160 | 220 | 200 | 65 | 70 | 90 | 100 | 60 | 270 |
| 学生编号i | 11 | 12 | 13 | 14 | 15 | 16 | 17 | 18 | 19 | 20 |
| 数学成绩 | 75 | 74 | 72 | 70 | 68 | 66 | 60 | 50 | 39 | 35 |
| 知识竞赛成绩 | 45 | 35 | 40 | 50 | 25 | 30 | 20 | 15 | 10 | 5 |
,知识竞赛成绩的平均值是,并且,,.(1)求这组学生的数学成绩和知识竞赛成绩的样本相关系数(精确到0.01);
(2)设
,变量和变量的一组样本数据为,其中两两不相同,两两不相同.记在中的排名是第位,在中的排名是第位,.定义变量和变量的“斯皮尔曼相关系数”(记为)为变量的排名和变量的排名的样本相关系数.(i)记
,.证明:;(ii)用(i)的公式求得这组学生的数学成绩和知识竞赛成绩的“斯皮尔曼相关系数”约为0.91,简述“斯皮尔曼相关系数”在分析线性相关性时的优势.
注:参考公式与参考数据.
;;.
您最近一年使用:0次
2023-11-01更新
|
1545次组卷
|
11卷引用:山西省朔州市平鲁区李林中学2024届高三上学期开学摸底数学试题
山西省朔州市平鲁区李林中学2024届高三上学期开学摸底数学试题重庆市北碚区西南大学附中2024届高三上学期11月模拟测试数学试题(已下线)第十章 综合测试B(提升卷)(已下线)第三节 成对数据的统计分析(第一课时)一轮复习点点通(已下线)第八章 成对数据的统计分析(压轴题专练)-2023-2024学年高二数学单元速记·巧练(人教A版2019选择性必修第三册)(已下线)专题22 新高考新题型第19题新定义压轴解答题归纳(9大核心考点)(讲义)(已下线)第八章 成对数据的统计分析(压轴题专练)-2023-2024学年高二数学单元速记·巧练(沪教版2020选择性必修第二册)(已下线)第八章 成对数据的统计分析(单元重点综合测试)-2023-2024学年高二数学单元速记·巧练(沪教版2020选择性必修第二册)(已下线)专题8.6 成对数据的统计分析全章八大压轴题型归纳(拔尖篇)-2023-2024学年高二数学举一反三系列(人教A版2019选择性必修第三册)单元测试B卷——第八章 成对数据的统计分析(已下线)专题8.8 成对数据的统计分析全章综合测试卷(提高篇)-2023-2024学年高二数学举一反三系列(人教A版2019选择性必修第三册)
名校
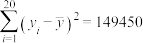
5 . 某校20名学生的数学成绩 和知识竞赛成绩
 如下表:
如下表:
计算可得数学成绩的平均值是 ,知识竞赛成绩的平均值是
 ,并且
,并且 ,
, ,
, .
.
(1)求这组学生的数学成绩和知识竞赛成绩的样本相关系数(精确到 ).
).
(2)设,变量和变量的一组样本数据为 ,其中
,其中 两两不相同,
 两两不相同.记在
 中的排名是第位,在
 中的排名是第位,
 .定义变量和变量的“斯皮尔曼相关系数”(记为)为变量的排名和变量的排名的样本相关系数.
(i)记,.证明:.
(ii)用(i)的公式求这组学生的数学成绩和知识竞赛成绩的“斯皮尔曼相关系数”(精确到).
(3)比较(1)和(2)(ii)的计算结果,简述“斯皮尔曼相关系数”在分析线性相关性时的优势.
注:参考公式与参考数据.; ;.
;.
和知识竞赛成绩如下表:学生编号 | 1 | 2 | 3 | 4 | 5 | 6 | 7 | 8 | 9 | 10 |
数学成绩 | 100 | 99 | 96 | 93 | 90 | 88 | 85 | 83 | 80 | 77 |
知识竞赛成绩 | 290 | 160 | 220 | 200 | 65 | 70 | 90 | 100 | 60 | 270 |
学生编号 | 11 | 12 | 13 | 14 | 15 | 16 | 17 | 18 | 19 | 20 |
数学成绩 | 75 | 74 | 72 | 70 | 68 | 66 | 60 | 50 | 39 | 35 |
知识竞赛成绩 | 45 | 35 | 40 | 50 | 25 | 30 | 20 | 15 | 10 | 5 |
 ,知识竞赛成绩的平均值是,并且,,.
(1)求这组学生的数学成绩和知识竞赛成绩的样本相关系数(精确到
).(2)设
,变量和变量的一组样本数据为,其中两两不相同,两两不相同.记在中的排名是第位,在中的排名是第位,.定义变量和变量的“斯皮尔曼相关系数”(记为)为变量的排名和变量的排名的样本相关系数.(i)记
,.证明:.(ii)用(i)的公式求这组学生的数学成绩和知识竞赛成绩的“斯皮尔曼相关系数”(精确到
).(3)比较(1)和(2)(ii)的计算结果,简述“斯皮尔曼相关系数”在分析线性相关性时的优势.
注:参考公式与参考数据.
;;.
您最近一年使用:0次
2023-05-19更新
|
1201次组卷
|
7卷引用:2023届高三新高考数学原创模拟试题
2023届高三新高考数学原创模拟试题浙江省宁波市奉化区九校联考2022-2023学年高二下学期期末模拟数学试题重庆市江北区第十八中学2023-2024学年高三上学期11月检测(一)数学试题(已下线)第八章 成对数据的统计分析(压轴题专练)-2023-2024学年高二数学单元速记·巧练(人教A版2019选择性必修第三册)(已下线)第9章 统计 章末题型归纳总结-【帮课堂】2023-2024学年高二数学同步学与练(苏教版2019选择性必修第二册)辽宁省部分名校2023-2024学年高二下学期5月质检数学试题(已下线)统计与成对数据的统计分析-综合测试卷B卷
名校
解题方法
6 . 为调查某地区植被覆盖面积x(单位:公顷)和野生动物数量y的关系,某研究小组将该地区等面积划分为200个区块,从中随机抽取20个区块,得到样本数据 ,部分数据如下:
经计算得: ,
, ,
, ,
, .
.
(1)利用最小二乘法估计建立y关于x的线性回归方程 ;
;
(2)该小组又利用这组数据建立了x关于y的线性回归方程 ,并把这两条拟合直线画在同一坐标系xOy下,横坐标x,纵坐标y的意义与植被覆盖面积x和野生动物数量y一致.
(i)求这两条直线的公共点坐标.
(ii)比较与的斜率大小,并证明.
附:y关于x的线性回归方程 中.,,
中.,,
,部分数据如下:| x | … | 2.7 | 3.6 | 3.2 | … |
| y | … | 57.8 | 64.7 | 62.6 | … |
,,,.(1)利用最小二乘法估计建立y关于x的线性回归方程
;(2)该小组又利用这组数据建立了x关于y的线性回归方程
,并把这两条拟合直线画在同一坐标系xOy下,横坐标x,纵坐标y的意义与植被覆盖面积x和野生动物数量y一致.(i)求这两条直线的公共点坐标.
(ii)比较
与的斜率大小,并证明.附:y关于x的线性回归方程
中.,,
您最近一年使用:0次
名校
解题方法
7 . 为调查某地区植被覆盖面积x(单位:公顷)和野生动物数量y的关系,某研究小组将该地区等面积划分为200个区块,从中随机抽取20个区块,得到样本数据,部分数据如下:
经计算得: .
.
(1)利用最小二乘估计建立y关于x的线性回归方程;
(2)该小组又利用这组数据建立了x关于y的线性回归方程,并把这两条拟合直线画在同一坐标系 下,横坐标x,纵坐标y的意义与植被覆盖面积x和野生动物数量y一致,
(ⅰ)比较前者与后者的斜率大小,并证明;
(ⅱ)求这两条直线的公共点坐标.
附:y关于x的回归方程中,斜率和截距的最小二乘估计公式分别为: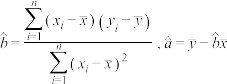 .
.
,部分数据如下:| x | … | 2.7 | 3.6 | 3.2 | … |
| y | … | 57.8 | 64.7 | 62.6 | … |
.(1)利用最小二乘估计建立y关于x的线性回归方程;
(2)该小组又利用这组数据建立了x关于y的线性回归方程,并把这两条拟合直线画在同一坐标系
下,横坐标x,纵坐标y的意义与植被覆盖面积x和野生动物数量y一致,(ⅰ)比较前者与后者的斜率大小,并证明;
(ⅱ)求这两条直线的公共点坐标.
附:y关于x的回归方程
中,斜率和截距的最小二乘估计公式分别为:.
您最近一年使用:0次
2023-02-05更新
|
1464次组卷
|
4卷引用:湖北省十七所重点中学2023届高三下学期2月第一次联考数学试题
湖北省十七所重点中学2023届高三下学期2月第一次联考数学试题(已下线)专题3全真拔高模拟3(人教A版)(已下线)专题3 全真拔高模拟3(北师大2019版)黑龙江省牡丹江市第一高级中学2023-2024学年高二下学期5月期中考试数学试题
名校
解题方法
8 . 为调查某地区植被覆盖面积x(单位:公顷)和野生动物数量y的关系,某研究小组将该地区等面积花分为400个区块,从中随机抽取40个区块,得到样本数据 (
( ),部分数据如下:
经计算得: ,
, ,
, ,
, .
.
(1)利用最小二乘估计建立y关于x的线性回归方程;
(2)该小组又利用这组数据建立了x关于y的线性回归方程,并把这两条拟合直线画在同一坐标系下,横坐标x,纵坐标y的意义与植被覆盖面积x和野生动物数量y一致.设前者与后者的斜率分别为 ,
, ,比较,的大小关系,并证明.
附:y关于x的回归方程 中,斜率和截距的最小二乘估计公式分别为:
 ,
, ,
,
(),部分数据如下:| x | … | 2.7 | 3.6 | 3.2 | 3.9 | … |
| y | … | 50.6 | 63.7 | 52.1 | 54.3 | … |
,,,.(1)利用最小二乘估计建立y关于x的线性回归方程;
(2)该小组又利用这组数据建立了x关于y的线性回归方程,并把这两条拟合直线画在同一坐标系
下,横坐标x,纵坐标y的意义与植被覆盖面积x和野生动物数量y一致.设前者与后者的斜率分别为,,比较,的大小关系,并证明.附:y关于x的回归方程
中,斜率和截距的最小二乘估计公式分别为: ,,
您最近一年使用:0次
2023-06-11更新
|
621次组卷
|
3卷引用:安徽省五校(蒙城一中涡阳一中、淮南一中、怀远一中、颖上一中)2023届高三第二次五校5月联考数学试题
安徽省五校(蒙城一中涡阳一中、淮南一中、怀远一中、颖上一中)2023届高三第二次五校5月联考数学试题(已下线)第02讲 成对数据的统计分析(五大题型)(讲义)河南省郑州市维纲中学2022-2023学年高二下学期期末测评数学试卷
9 . 下列说法中正确的是( ).
A.对于独立性检验,随机变量 的观测值越小,判定“两个分类变量有关系”犯错误的概率越大 的观测值越小,判定“两个分类变量有关系”犯错误的概率越大 |
B.在回归分析中,对一组给定的样本数据 , , ,…, ,…, ,样本数据的线性相关程度越强,则r越接近1 ,样本数据的线性相关程度越强,则r越接近1 |
C.如果散点图中所有的样本点都落在一条斜率为非零实数的直线上,则 |
D.若用反证法证明:若 ,则 ,则 ,应先假设 ,应先假设 且 且 |
您最近一年使用:0次
解题方法
10 . 根据统计,某蔬菜基地西红柿亩产量的增加量(百千克)与某种肥料每亩使用量(千克)之间对应数据如下表所示.
(1)由给出的参考公式证明:相关系数
(2)请从相关系数(精确到)的角度分析,能否用线性回归模型拟合与的关系 若
若 ,则线性相关程度很强,可用线性回归模型拟合
 若能,建立关于的线性回归方程,若不能,请说明理由.
参考公式:对于一组数据 ,相关系数
,相关系数 ,
,
回归直线 的斜率和截距的最小二乘估计分别为:
 .
.
参考数据: ,
, ,
, ,
, ,
, ,
, ,
, .其中
.其中 ,分别为肥料每亩使用量和西红柿亩产量的增加量.
(百千克)与某种肥料每亩使用量(千克)之间对应数据如下表所示.
|
|
|
|
|
|
|
|
|
|
|
|


(2)请从相关系数
(精确到)的角度分析,能否用线性回归模型拟合与的关系若,则线性相关程度很强,可用线性回归模型拟合若能,建立关于的线性回归方程,若不能,请说明理由.参考公式:对于一组数据
,相关系数,回归直线
的斜率和截距的最小二乘估计分别为:.参考数据:
,,,,,,.其中,分别为肥料每亩使用量和西红柿亩产量的增加量.
您最近一年使用:0次


