名校
1 . 甲、乙、丙、丁各自研究两个随机变量的数据,若甲、乙、丙、丁计算得到各自研究的两个随机变量的线性相关系数分别为 ,
, ,
, ,
, ,则这四人中,
______ 研究的两个随机变量的线性相关程度最高.
,,,,则这四人中,
您最近一年使用:0次
2024-04-10更新
|
830次组卷
|
6卷引用:青海省部分学校2023-2024学年高三下学期联考模拟预测文科数学试题
名校
解题方法
2 . 某公司对其产品研发的年投资额 (单位:百万元)与其年销售量
 (单位:千件)的数据进行统计,整理后得到如下统计表;
(1)求变量和的样本相关系数 (精确到0.01),并推断变量和的线性相关程度;(参考;若
 ,则线性相关性程度很强;若
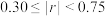 ,则线性相关性程度一般,若
 ,则线性相关性程度很弱.)
(2)求年销售量关于年投资额的经验回归方程.
参考公式:样本相关系数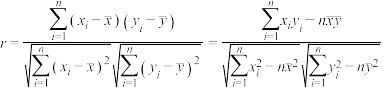 ;经验回归方程
 中
中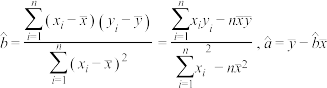 ;参考数据
;参考数据
(单位:百万元)与其年销售量(单位:千件)的数据进行统计,整理后得到如下统计表; | 1 | 2 | 3 | 4 | 5 |
| 1.5 | 2 | 3.5 | 8 | 15 |
和的样本相关系数(精确到0.01),并推断变量和的线性相关程度;(参考;若,则线性相关性程度很强;若,则线性相关性程度一般,若,则线性相关性程度很弱.)(2)求年销售量
关于年投资额的经验回归方程.参考公式:样本相关系数
;经验回归方程中;参考数据
您最近一年使用:0次
2023-06-17更新
|
565次组卷
|
3卷引用:青海省海南藏族自治州高级中学2022-2023学年高二下学期期末考试数学(文)试题
3 . 如果发现散点图中所有的样本点都落在一条斜率为非0实数的直线上,则下列说法错误的是( )
| A.解释变量和预报变量是一次函数关系 | B.相关指数 |
| C.残差平方和为0 | D.相关系数 |
您最近一年使用:0次
2021-07-27更新
|
190次组卷
|
3卷引用:青海省西宁市大通回族土族自治县2020-2021学年高二下学期期末联考数学(理)试题
青海省西宁市大通回族土族自治县2020-2021学年高二下学期期末联考数学(理)试题青海省西宁市大通回族土族自治县2020-2021学年高二下学期期末联考数学(文)试题(已下线)8.2一元线性回归模型及其应用A卷


