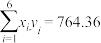
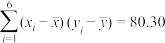
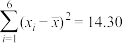
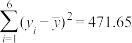
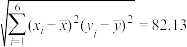
1 . 研究机构对某校学生往返校时间的统计资料表明:该校学生居住地到学校的距离 (单位:千米)和学生花费在上学路上的时间
 (单位:分钟)有如下的统计资料:
如果统计资料表明与有线性相关关系,试求:
(1)判断与是否有很强的线性相关性?
(相关系数 的绝对值大于0.75时,认为两个变量有很强的线性相关性,精确到0.01)
(2)求线性回归方程 (精确到0.01);
(3)将 分钟的时间数据
 称为美丽数据,现从这6个时间数据中任取2个,求抽取的2个数据全部为美丽数据的概率.
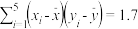
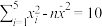
参考数据: ,
, ,
, ,
, ,
,
 ,
,
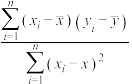
参考公式: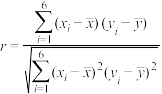 ,
,
(单位:千米)和学生花费在上学路上的时间(单位:分钟)有如下的统计资料:| 到学校的距离(千米) | 1.8 | 2.6 | 3.1 | 4.3 | 5.5 | 6.1 |
| 花费的时间(分钟) | 17.8 | 19.6 | 27.5 | 31.3 | 36.0 | 43.2 |
与有线性相关关系,试求:(1)判断
与是否有很强的线性相关性?(相关系数
的绝对值大于0.75时,认为两个变量有很强的线性相关性,精确到0.01)(2)求线性回归方程
(精确到0.01);(3)将
分钟的时间数据称为美丽数据,现从这6个时间数据中任取2个,求抽取的2个数据全部为美丽数据的概率.参考数据:
,,,,,参考公式:
,
您最近一年使用:0次
2019-04-02更新
|
2220次组卷
|
2卷引用:【市级联考】湖南省郴州市2019届高三第二次教学质量监测试卷数学(文)试题
2 . 设两个变量x和y之间具有线性相关关系,它们的相关系数为r,y关于x的回归直线方程为 ,则
,则

,则 | A.k与r的符号相同 | B.b与r的符号相同 |
| C.k与r的符号相反 | D.b与r的符号相反 |
您最近一年使用:0次
2019-03-31更新
|
919次组卷
|
4卷引用:【校级联考】陕西省西安地区陕师大附中、西安高级中学、高新一中、铁一中学、西工大附中等八校2019届高三3月联考数学(文)试题
【校级联考】陕西省西安地区陕师大附中、西安高级中学、高新一中、铁一中学、西工大附中等八校2019届高三3月联考数学(文)试题人教B版(2019) 选择性必修第二册 过关斩将 第四章 概率与统计 4.3 统计模型 4.3 综合拔高练(已下线)专题12 变量之间的相关关系(重点练)-2020-2021学年高一数学十分钟同步课堂专练(人教A版必修3)沪教版(2020) 选修第二册 堂堂清 第8章 单元复习八
名校
3 . 下列说法错误 的是
| A.在回归模型中,预报变量的值不能由解释变量唯一确定 |
B.若变量,满足关系 ,且变量与 ,且变量与 正相关,则与也正相关 正相关,则与也正相关 |
| C.在残差图中,残差点分布的带状区域的宽度越狭窄,其模型拟合的精度越高 |
D.以模型 去拟合一组数据时,为了求出回归方程,设 去拟合一组数据时,为了求出回归方程,设 ,将其变换后得到线性方程 ,将其变换后得到线性方程 ,则 ,则 , , |
您最近一年使用:0次
2019-03-26更新
|
970次组卷
|
4卷引用:湖南师大附中2019届高三月考试题(七) 数学(理)
4 . 某小学举办“父母养育我,我报父母恩”的活动,对六个年级(一年级到六年级的年级代码分别为1,2…,6)的学生给父母洗脚的百分比y%进行了调查统计,绘制得到下面的散点图.

(1)由散点图看出,可用线性回归模型拟合y与x的关系,请用相关系数加以说明;
(2)建立y关于x的回归方程,并据此预计该校学生升入中学的第一年(年级代码为7)给父母洗脚的百分比.
附注:参考数据: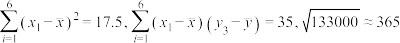
参考公式:相关系数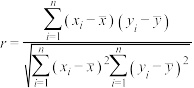 ,若r>0.95,则y与x的线性相关程度相当高,可用线性回归模型拟合y与x的关系.回归方程
 中斜率与截距的最小二乘估计公式分别为
 =
= ,
, .
.
(1)由散点图看出,可用线性回归模型拟合y与x的关系,请用相关系数加以说明;
(2)建立y关于x的回归方程,并据此预计该校学生升入中学的第一年(年级代码为7)给父母洗脚的百分比.
附注:参考数据:
参考公式:相关系数
,若r>0.95,则y与x的线性相关程度相当高,可用线性回归模型拟合y与x的关系.回归方程中斜率与截距的最小二乘估计公式分别为= ,.
您最近一年使用:0次
2019-03-25更新
|
1733次组卷
|
10卷引用:【校级联考】河北省省级示范性高中联合体2019届高三3月联考数学(文)试题
【校级联考】河北省省级示范性高中联合体2019届高三3月联考数学(文)试题吉林省四平一中2019届高三下学期第二次联合模拟考试文科数学试题【省级联考】甘青宁2019届高三3月联考数学(文)试题河北省邯郸市2019届高三第一次模拟考试数学(文)试题.【校级联考】甘肃宁夏青海三省3月联考2019届高三数学考试试题【校级联考】黑龙江省大庆市实验中学2019届高三下学期数学二模考试(文)数学试题2019届甘肃省白银市靖远县高三第三次联考数学(文)试题四川省泸州市泸县第一中学2019-2020学年高三下学期第二次月考数学(文)试题(已下线)专题18 概率与统计综合-2020年高考数学(理)母题题源解密(全国Ⅱ专版)(已下线)专题18 概率与统计综合-2020年高考数学(文)母题题源解密(全国Ⅱ专版)
名校
5 . 节能降耗是企业的生存之本,树立一种“点点滴滴降成本,分分秒秒增效益”的节能意识,以最好的管理,来实现节能效益的最大化 为此某国企进行节能降耗技术改造,下面是该国企节能降耗技术改造后连续五年的生产利润:
预测第8年该国企的生产利润约为 千万元
参考公式及数据: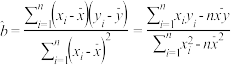 ;
; ,
, ,
,
为此某国企进行节能降耗技术改造,下面是该国企节能降耗技术改造后连续五年的生产利润:| 年号 | 1 | 2 | 3 | 4 | 5 |
年生产利润 单位:千万元 单位:千万元 |  |  | 1 |  |  |
预测第8年该国企的生产利润约为
千万元参考公式及数据:;,,A. | B. | C. | D. |
您最近一年使用:0次
2019-03-20更新
|
1452次组卷
|
5卷引用:【省级联考】四川省高中2019届毕业班第二次诊断性考试数学(理)试题
【省级联考】四川省高中2019届毕业班第二次诊断性考试数学(理)试题【全国百强校】广东省佛山市第二中学2018-2019学年第二学期第三次月考高二级数学(理)试题湖南省长沙市明德中学2019-2020学年高二上学期第一次月考数学试题人教B版(2019) 选择性必修第二册 过关斩将 第四章 概率与统计 4.3 统计模型 4.3.1 一元线性回归模型(已下线)期末综合检测02-2020-2021学年高二数学下学期期末专项复习(苏教版选修2-2、2-3)
名校
6 . 近年来,随着互联网技术的快速发展,共享经济覆盖的范围迅速扩张,继共享单车、共享汽车之后,共享房屋以“民宿”、“农家乐”等形式开始在很多平台上线.某创业者计划在某景区附近租赁一套农房发展成特色“农家乐”,为了确定未来发展方向,此创业者对该景区附近六家“农家乐”跟踪调查了 天.得到的统计数据如下表,为收费标准(单位:元/日),
 为入住天数(单位:),以频率作为各自的“入住率”,收费标准与“入住率”的散点图如图

(1)若从以上六家“农家乐”中随机抽取两家深入调查,记 为“入住率”超过
 的农家乐的个数,求的概率分布列;
(2)令 ,由散点图判断
 与
与 哪个更合适于此模型(给出判断即可,不必说明理由)?并根据你的判断结果求回归方程.(
 结果保留一位小数)
(3)若一年按 天计算,试估计收费标准为多少时,年销售额
 最大?(年销售额
 入住率
入住率 收费标准)
收费标准)
参考数据:

天.得到的统计数据如下表,为收费标准(单位:元/日),为入住天数(单位:),以频率作为各自的“入住率”,收费标准与“入住率”的散点图如图| x | 50 | 100 | 150 | 200 | 300 | 400 |
| t | 90 | 65 | 45 | 30 | 20 | 20 |
(1)若从以上六家“农家乐”中随机抽取两家深入调查,记
为“入住率”超过的农家乐的个数,求的概率分布列;(2)令
,由散点图判断与哪个更合适于此模型(给出判断即可,不必说明理由)?并根据你的判断结果求回归方程.(结果保留一位小数)(3)若一年按
天计算,试估计收费标准为多少时,年销售额最大?(年销售额入住率收费标准)参考数据:
您最近一年使用:0次
2019-03-19更新
|
2219次组卷
|
5卷引用:【市级联考】河北省沧州市2019年普通高等学校招生全国统一模拟考试理科数学试题
【市级联考】河北省沧州市2019年普通高等学校招生全国统一模拟考试理科数学试题【市级联考】河北省张家口市、沧州市2019届高三3月联考数学A类(理科)试题2019届 河南省名校(鹤壁市高级中学)高三下学期压轴第三次考试数学(理)试题(已下线)专题35 变量间的相关关系、统计案例-冲刺2020高考跳出题海之高三数学模拟试题精中选萃湖南省岳阳市岳阳县2021届高三下学期高考适应性考试数学试题
2019高一下·全国·专题练习
7 . 如图所示,给出了样本容量均为7的A、B两组样本数据的散点图,已知A组样本数据的相关系数为r1,B组数据的相关系数为r2,则
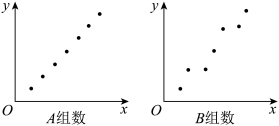
| A.r1=r2 | B.r1<r2 | C.r1>r2 | D.无法判定 |
您最近一年使用:0次
2019-03-15更新
|
874次组卷
|
5卷引用:2020届陕西省榆林市高三第三次模拟数学(文)试题
2020届陕西省榆林市高三第三次模拟数学(文)试题(已下线)第43练 统计及统计案例-2021年高考数学(文)一轮复习小题必刷2020届陕西省榆林市高三第三次模拟数学(理)试题(已下线)2019年3月15日《每日一题》必修3 变量之间的相关关系广东省梅州市2018-2019学年高二下学期期末考试数学(理)试题
8 . 某公司生产一种产品,从流水线上随机抽取100件产品,统计其质量指数并绘制频率分布直方图(如图1):
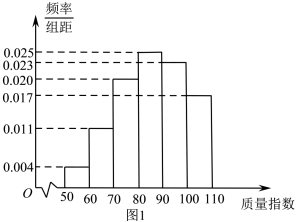
产品的质量指数在 的为三等品,在
 的为二等品,在
 的为一等品,该产品的三、二、一等品的销售利润分别为每件1.5,3.5,5.5(单位:元),以这100件产品的质量指数位于各区间的频率代替产品的质量指数位于该区间的概率.
(1)求每件产品的平均销售利润;
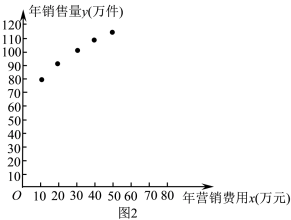
(2)该公司为了解年营销费用(单位:万元)对年销售量(单位:万件)的影响,对近5年的年营销费用 和年销售量
和年销售量
 数据做了初步处理,得到的散点图(如图2)及一些统计量的值.
表中 ,
, ,
, ,
,
根据散点图判断, 可以作为年销售量(万件)关于年营销费用(万元)的回归方程.
(ⅰ)建立关于的回归方程;
(ⅱ)用所求的回归方程估计该公司应投入多少营销费,才能使得该产品一年的收益达到最大?(收益=销售利润-营销费用,取 )
)
参考公式:对于一组数据: ,
, ,
, ,
, ,其回归直线
 的斜率和截距的最小乘估计分别为
 ,
,
产品的质量指数在
的为三等品,在的为二等品,在的为一等品,该产品的三、二、一等品的销售利润分别为每件1.5,3.5,5.5(单位:元),以这100件产品的质量指数位于各区间的频率代替产品的质量指数位于该区间的概率.(1)求每件产品的平均销售利润;
(2)该公司为了解年营销费用
(单位:万元)对年销售量(单位:万件)的影响,对近5年的年营销费用和年销售量数据做了初步处理,得到的散点图(如图2)及一些统计量的值. |  |  |  |
| 16.30 | 24.87 | 0.41 | 1.64 |
表中
,,,根据散点图判断,
可以作为年销售量(万件)关于年营销费用(万元)的回归方程.(ⅰ)建立
关于的回归方程;(ⅱ)用所求的回归方程估计该公司应投入多少营销费,才能使得该产品一年的收益达到最大?(收益=销售利润-营销费用,取
)参考公式:对于一组数据:
,,,,其回归直线的斜率和截距的最小乘估计分别为,
您最近一年使用:0次
名校
9 . 下列四个结论中正确的个数是
(1)对于命题 使得
使得 ,则
,则 都有
都有 ;
;
(2)已知 ,则
,则 
(3)已知回归直线的斜率的估计值是2,样本点的中心为(4,5),则回归直线方程为 ;
;
(4)“ ”是“
”是“ ”的充分不必要条件.
(1)对于命题
使得,则都有;(2)已知
,则 (3)已知回归直线的斜率的估计值是2,样本点的中心为(4,5),则回归直线方程为
;(4)“
”是“”的充分不必要条件.| A.1 | B.2 | C.3 | D.4 |
您最近一年使用:0次
2019-03-11更新
|
1393次组卷
|
7卷引用:四川省眉山中学2017届高三5月月考数学(理)试题
10 . 下列说法中正确的个数是
①相关系数用来衡量两个变量之间线性关系的强弱, 越接近于1,相关性越弱;
②回归直线过样本点中心 ;
;
③相关指数 用来刻画回归的效果,越小,说明模型的拟合效果越不好.
①相关系数
用来衡量两个变量之间线性关系的强弱,越接近于1,相关性越弱;②回归直线
过样本点中心;③相关指数
用来刻画回归的效果,越小,说明模型的拟合效果越不好.| A.0 | B.1 | C.2 | D.3 |
您最近一年使用:0次
2019-03-11更新
|
1778次组卷
|
6卷引用:【市级联考】湖北省恩施州2019届高三2月教学质量检测数学(文)试题
【市级联考】湖北省恩施州2019届高三2月教学质量检测数学(文)试题(已下线)专题35 变量间的相关关系、统计案例-冲刺2020高考跳出题海之高三数学模拟试题精中选萃(已下线)专题05 统计——2020年高考数学(理)母题题源解密(全国Ⅰ专版)(已下线)专题05 统计——2020年高考数学(文)母题题源解密(全国Ⅰ专版)山西省运城市2019-2020学年高二(下)期末数学(理科)试题广西河池市2020-2021学年高二下学期八校第一次联考数学(文)试题


