名校
解题方法
1 . 某同学暑期做社会实践活动.对气温与某饮料的销量之间的关系进行调研,记录连续5天的数据如下:
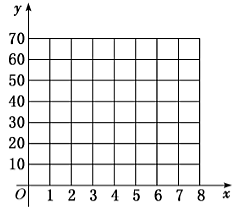
(1)在给定的坐标系中画出表中数据的散点图;

(2)求出 关于
关于 的线性回归方程
 ,试预测气温是15度时大约可销售多少杯(取整数)?
(注: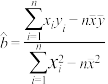 ,
, )
)
气温x( ) ) | 9 | 10 | 12 | 11 | 8 |
| 销量y(杯) | 22 | 25 | 29 | 26 | 20 |
(2)求出
关于的线性回归方程,试预测气温是15度时大约可销售多少杯(取整数)?(注:
,)
您最近一年使用:0次
解题方法
2 . 以下是收集到的新房屋销售价格y与房屋大小x的数据:
(1)画出数据的散点图;
(2)用最小二乘法估计求线性回归方程.以下是所用到的公式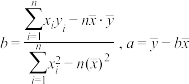
| 房屋大小x(m2) | 80 | 105 | 110 | 115 | 135 |
| 销售价格y(万元) | 18.4 | 22 | 21.6 | 24.8 | 29.2 |
(2)用最小二乘法估计求线性回归方程.以下是所用到的公式
您最近一年使用:0次
解题方法
3 . 下表提供了某厂节能降耗技术改造后生产甲产品过程中记录的产量(吨)与相应的生产能耗(吨)标准煤的几组对照数据:
(1)请画出上表数据的散点图;
(2)请根据上表提供的数据,用最小二乘法求出关于的线性回归方程 ;
;
(3)已知该厂技术改造前100吨甲产品能耗为90吨标准煤,试根据(2)求出的线性回归方程,预测生产100吨甲产品的生产能耗比技术改造前降低多少吨标准煤?
(参考:用最小二乘法求线性回归方程系数公式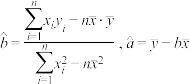 )
)
(参考数值:3×2.5+4×3+5×4+6×4.5=66.5 32+42+52+62=86)
吨)与相应的生产能耗(吨)标准煤的几组对照数据: | 3 | 4 | 5 | 6 |
| 2.5 | 3 | 4 | 4.5 |
(1)请画出上表数据的散点图;
(2)请根据上表提供的数据,用最小二乘法求出
关于的线性回归方程;(3)已知该厂技术改造前100吨甲产品能耗为90吨标准煤,试根据(2)求出的线性回归方程,预测生产100吨甲产品的生产能耗比技术改造前降低多少吨标准煤?
(参考:用最小二乘法求线性回归方程系数公式
)(参考数值:3×2.5+4×3+5×4+6×4.5=66.5 32+42+52+62=86)
您最近一年使用:0次
解题方法
4 . 某奶茶店为了解冰冻奶茶销售量与气温之间的关系,随机统计并制作了某5天卖出冰冻奶茶的杯数与当天气温的对照表:
(1)画出散点图;
(2)求出变量,之间的线性回归方程;若该奶茶店制定某天的销售目标为 杯,当该天的气温是
 时,该奶茶店能否完成销售目标?
注:线性回归方程的系数计算公式: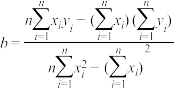 ,
, .
.
(参考数据: ,
, )
)
与当天气温的对照表:| 温度/℃ | 15 | 20 | 25 | 30 | 35 |
| 冰冻奶茶杯数/十杯 | 5 | 7 | 9 | 8 | 10 |
(1)画出散点图;
(2)求出变量
,之间的线性回归方程;若该奶茶店制定某天的销售目标为杯,当该天的气温是时,该奶茶店能否完成销售目标?注:线性回归方程
的系数计算公式:,.(参考数据:
,)
您最近一年使用:0次
2020-07-25更新
|
151次组卷
|
2卷引用:江苏省宿迁市2019-2020学年高一下学期期末数学试题
名校
解题方法
5 . 某研究机构对高三学生的记忆力和判断力进行统计分析,得下表①数据,并可作出上表数据的散点图②.
(1)请根据上表提供的数据及散点图,求出关于的线性回归方程;
(2)试根据(1)求出的线性回归方程,预测记忆力为 的同学的判断力.
和判断力进行统计分析,得下表①数据,并可作出上表数据的散点图②.
|
|
|
|
|
|
|
|
|
|


(1)请根据上表提供的数据及散点图,求出
关于的线性回归方程;(2)试根据(1)求出的线性回归方程,预测记忆力为
的同学的判断力.
您最近一年使用:0次
2021-11-13更新
|
180次组卷
|
7卷引用:2015-2016学年山西省怀仁县一中高一12月月考数学试卷
名校
解题方法
6 . 某个服装店经营某种服装,在某周内每天获得的纯利润 (元)与该周每天销售这种服装数量
 (件)之间的一组数据关系如下表:
已知: ,
, ,
, .
.
参考公式:线性回归方程是 ,其中
,其中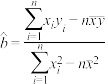 ,
, .
.
(1)求 ,
, ;
;
(2)画出散点图;
(3)求每天的纯利润与每天销售数量之间的线性回归方程.
(元)与该周每天销售这种服装数量(件)之间的一组数据关系如下表: | 3 | 4 | 5 | 6 | 7 | 8 | 9 |
| 66 | 69 | 73 | 81 | 89 | 90 | 91 |
,,.参考公式:线性回归方程是
,其中,.(1)求
,;(2)画出散点图;
(3)求每天的纯利润
与每天销售数量之间的线性回归方程.
您最近一年使用:0次
2021-09-22更新
|
279次组卷
|
5卷引用:2015-2016学年山西怀仁一中高一下第一次月考理科数学卷
解题方法
7 . 下面给出了根据我国2012年~2018年水果人均占有量(单位: )和年份代码绘制的散点图和线性回归方程的残差图(2012年~2018年的年份代码分别为1~7).
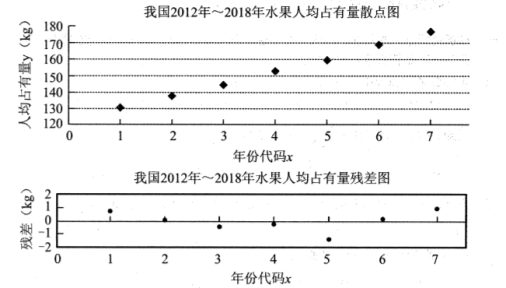
(1)根据散点图分析与之间的相关关系;
(2)根据散点图相应数据计算得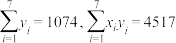 ,求关于的线性回归方程;
(3)根据线性回归方程的残差图,分析线性回归方程的拟合效果.(精确到0.01)
(单位:)和年份代码绘制的散点图和线性回归方程的残差图(2012年~2018年的年份代码分别为1~7).(1)根据散点图分析
与之间的相关关系;(2)根据散点图相应数据计算得
,求关于的线性回归方程;(3)根据线性回归方程的残差图,分析线性回归方程的拟合效果.(精确到0.01)
您最近一年使用:0次
名校
解题方法
8 . 一商场对5年来春节期间服装类商品的优惠金额(单位:万元)与销售额(单位:万元)之间的关系进行分析研究并做了记录,得到如下表格.
(1)画出散点图,并判断服装类商品的优惠金额与销售额是正相关还是负相关;
(2)根据表中提供的数据,求出与的回归方程;
(3)若2019年春节期间商场预定的服装类商品的优惠金额为10万元,估计该商场服装类商品的销售额.
参考公式: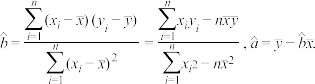
参考数据: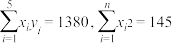
(单位:万元)与销售额(单位:万元)之间的关系进行分析研究并做了记录,得到如下表格.| 日期 | 2014年 | 2015年 | 2016年 | 2017年 | 2018年 |
| 2 | 4 | 5 | 6 | 8 |
| 30 | 40 | 60 | 50 | 70 |
(2)根据表中提供的数据,求出
与的回归方程;(3)若2019年春节期间商场预定的服装类商品的优惠金额为10万元,估计该商场服装类商品的销售额.
参考公式:
参考数据:
您最近一年使用:0次
2020-02-27更新
|
226次组卷
|
2卷引用:山西省2019-2020学年高一上学期期末数学试题
解题方法
9 . 在测量一根新弹簧的劲度系数时,测得了如下的结果:
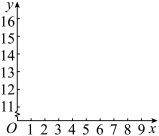
(1)请在下图坐标系中画出上表所给数据的散点图;
(2)若弹簧长度与所挂物体重量之间的关系具有线性相关性,请根据上表提供的数据,用最小二乘法求出y关于x的线性回归方程 ;
;
(3)根据回归方程,求挂重量为 的物体时弹簧的长度.所求得的长度是弹簧的实际长度吗?为什么?
注:本题中的计算结果保留小数点后两位.
(参考公式: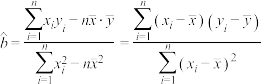 ,
, )
)
(参考数据: ,
, )
)
所挂重量( )(x) )(x) | 1 | 2 | 3 | 5 | 7 | 9 |
弹簧长度( )(y) )(y) | 11 | 12 | 12 | 13 | 14 | 16 |
(1)请在下图坐标系中画出上表所给数据的散点图;
(2)若弹簧长度与所挂物体重量之间的关系具有线性相关性,请根据上表提供的数据,用最小二乘法求出y关于x的线性回归方程
;(3)根据回归方程,求挂重量为
的物体时弹簧的长度.所求得的长度是弹簧的实际长度吗?为什么?注:本题中的计算结果保留小数点后两位.
(参考公式:
,)(参考数据:
,)
您最近一年使用:0次
名校
解题方法
10 . 某车间为了规定工时定额,需要确定加工零件所花费的时间,为此做了四次试验,得到的数据如表:
(1)在给定的坐标系中画出表中数据的散点图.
(2)求出y关于x的线性回归方程,试预测加工10个零件需要多少小时?
(注:,)
| 零件的个数x(个) | 2 | 3 | 4 | 5 |
| 加工的时间y(小时) | 2.5 | 3 | 4 | 4.5 |
(1)在给定的坐标系中画出表中数据的散点图.
(2)求出y关于x的线性回归方程
,试预测加工10个零件需要多少小时?(注:
,)
您最近一年使用:0次
2020-06-16更新
|
387次组卷
|
4卷引用:广西天等中学2019-2020学年高二上学期期中考试数学文科试题


