1 . 若变量 ,
, 有如下观察的数据:
(1)画出散点图;
(2)判断变量 ,
, 是否具有相关关系?如果具有相关关系,那么是正相关还是负相关?
,有如下观察的数据:
| 151 | 152 | 153 | 154 | 156 | 157 | 158 | 159 | 160 | 162 | 163 | 164 |
| 40 | 41 | 41 | 41.5 | 42 | 42.5 | 43 | 44 | 45 | 45 | 46 | 45.5 |
(2)判断变量
,是否具有相关关系?如果具有相关关系,那么是正相关还是负相关?
您最近一年使用:0次
名校
2 . 某种蔬菜从1月1日起开始上市,通过市场调查,得到该蔬菜种植成本 (单位:元/
 )与上市时间
 (单位:10天)的数据如下表:
(1)根据上表数据,从下列函数: ,
, ,
, ,
, 中(其中
中(其中 ),选取一个合适的函数模型描述该蔬菜种植成本与上市时间的变化关系;
(2)利用你选取的函数模型,求该蔬菜种植成本最低时的上市时间及最低种植成本.
(单位:元/)与上市时间(单位:10天)的数据如下表:时间 | 5 | 11 | 25 |
种植成本 | 15 | 10.8 | 15 |
,,,中(其中),选取一个合适的函数模型描述该蔬菜种植成本与上市时间的变化关系;(2)利用你选取的函数模型,求该蔬菜种植成本最低时的上市时间及最低种植成本.
您最近一年使用:0次
2019-02-09更新
|
691次组卷
|
4卷引用:【市级联考】山东省滨州市2018-2019学年高一上学期期末考试数学试题
名校
解题方法
3 . 下表是某学生在4月份开始进入冲刺复习至高考前的5次大型联考数学成绩(分);
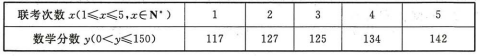
(1)请画出上表数据的散点图;

(2)①请根据上表提供的数据,用最小二乘法求出关于的线性回归方程;
②若在4月份开始进入冲刺复习前,该生的数学分数最好为116分,并以此作为初始分数,利用上述回归方程预测高考的数学成绩,并以预测高考成绩作为最终成绩,求该生4月份后复习提高率.(复习提高率=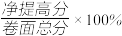 ,分数取整数)
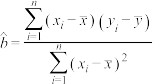
附:回归直线的斜率和截距的最小二乘估计公式分别为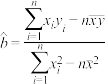 ,
, .
.
(1)请画出上表数据的散点图;
(2)①请根据上表提供的数据,用最小二乘法求出
关于的线性回归方程;②若在4月份开始进入冲刺复习前,该生的数学分数最好为116分,并以此作为初始分数,利用上述回归方程预测高考的数学成绩,并以预测高考成绩作为最终成绩,求该生4月份后复习提高率.(复习提高率=
,分数取整数)附:回归直线的斜率和截距的最小二乘估计公式分别为
,.
您最近一年使用:0次
2018-08-09更新
|
936次组卷
|
3卷引用:【衡水金卷压轴卷】2018年普通高等学校招生全国统一考试模拟试题文科数学(二)试题
4 . 某研究机构对某校高二文科学生的记忆力x和判断力y进行统计分析,得下表数据.
参考公式:
(1)请画出上表数据的散点图;
(2)请根据上表提供的数据,用最小二乘法求出y关于x的线性回归方程;
| x | 6 | 8 | 10 | 12 |
| y | 2 | 3 | 5 | 6 |
(1)请画出上表数据的散点图;
(2)请根据上表提供的数据,用最小二乘法求出y关于x的线性回归方程;
您最近一年使用:0次
名校
解题方法
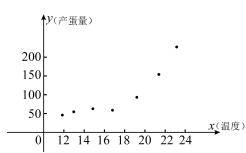
5 . 已知鸡的产蛋量与鸡舍的温度有关,为了确定下一个时段鸡舍的控制温度,某企业需要了解鸡舍的温度 (单位: ),对某种鸡的时段产蛋量(单位:
 ) 和时段投入成本
 (单位:万元)的影响,为此,该企业收集了7个鸡舍的时段控制温度
 和产蛋量
和产蛋量 的数据,对数据初步处理后得到了如图所示的散点图和表中的统计量的值.
其中 .
.
(1)根据散点图判断, 与
与 哪一个更适宜作为该种鸡的时段产蛋量关于鸡舍时段控制温度的回归方程类型?(给判断即可,不必说明理由)
(2)若用 作为回归方程模型,根据表中数据,建立关于的回归方程;
(3)已知时段投入成本与 的关系为
的关系为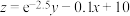 ,当时段控制温度为
 时,鸡的时段产蛋量及时段投入成本的预报值分别是多少?
附:①对于一组具有线性相关关系的数据 ,其回归直线
 的斜率和截距的最小二乘估计分别为
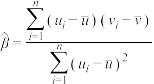 ,
, .
.
(单位:),对某种鸡的时段产蛋量(单位:) 和时段投入成本(单位:万元)的影响,为此,该企业收集了7个鸡舍的时段控制温度和产蛋量的数据,对数据初步处理后得到了如图所示的散点图和表中的统计量的值.
|
|
|
|
|
|
|
|
|
| 140 |
|
|
|


 .
.(1)根据散点图判断,
与哪一个更适宜作为该种鸡的时段产蛋量关于鸡舍时段控制温度的回归方程类型?(给判断即可,不必说明理由)(2)若用
作为回归方程模型,根据表中数据,建立关于的回归方程;(3)已知时段投入成本
与的关系为,当时段控制温度为时,鸡的时段产蛋量及时段投入成本的预报值分别是多少?附:①对于一组具有线性相关关系的数据
,其回归直线的斜率和截距的最小二乘估计分别为,.
|
|
|
|
|
0.08 | 0.47 | 2.72 | 20.09 | 1096.63 |


您最近一年使用:0次
2018-02-17更新
|
2542次组卷
|
3卷引用:湖北省荆州中学、宜昌一中等“荆、荆、襄、宜四地七校考试联盟”2018届高三2月联考数学(文)试题2
名校
6 . 1766年;人类已经发现的太阳系中的行星有金星、地球、火星、木星和土星.德国的一位中学教师戴维一提丢斯在研究了各行星离太阳的距离(单位:AU,AU是天文学中计量天体之间距离的一种单位)的排列规律后,预测在火星和木星之间应该还有一颗未被发现的行星存在,并按离太阳的距离从小到大列出了如下表所示的数据:
受他的启发,意大利天文学家皮亚齐于1801年终于发现了位于火星和木星之间的谷神星.
(1)为了描述行星离太阳的距离y与行星编号之间的关系,根据表中已有的数据画出散点图,并根据散点图的分布状况,从以下三种模型中选出你认为最符合实际的一种函数模型(直接给出结论即可);
① ;②
;② ;③
;③ .
.
(2)根据你的选择,依表中前几组数据求出函数解析式,并用剩下的数据检验模型的吻合情况;
(3)请用你求得的模型,计算谷神星离太阳的距离.
| 行星编号(x) | 1(金星) | 2(地球) | 3(火星) | 4( ) | 5(木星) | 6(土星) |
| 离太阳的距离(y) | 0.7 | 1.0 | 1.6 | 5.2 | 10.0 |
(1)为了描述行星离太阳的距离y与行星编号之间的关系,根据表中已有的数据画出散点图,并根据散点图的分布状况,从以下三种模型中选出你认为最符合实际的一种函数模型(直接给出结论即可);
①
;②;③.(2)根据你的选择,依表中前几组数据求出函数解析式,并用剩下的数据检验模型的吻合情况;
(3)请用你求得的模型,计算谷神星离太阳的距离.
您最近一年使用:0次
2020-01-31更新
|
439次组卷
|
5卷引用:山东省聊城市2019-2020学年高一上学期期末数学试题
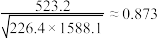
7 . 为了解某市高中男生身高与体重的关系,随机抽取5所高中学校,并获得这些学校全部男生的身高(单位:cm)与体重(单位:kg)的数据.为了减少篇幅,从中随机选取10名高中男生的身高与体重的数据,如表所示.试根据表中数据绘制散点图,计算相关系数并判断学生身高与体重的相关程度..
10名高中男生的身高与体重如下表:
附:相关系数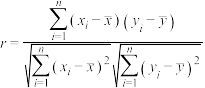 ,
,
10名高中男生的身高与体重如下表:
| 编号 | 1 | 2 | 3 | 4 | 5 | 6 | 7 | 8 | 9 | 10 |
| 身高/cm | 174 | 176 | 176 | 181 | 182 | 179 | 169 | 168 | 171 | 180 |
| 体重/kg | 55 | 58 | 62 | 74 | 88 | 68 | 54 | 52 | 56 | 86 |
,
您最近一年使用:0次
名校
解题方法
8 . 已知具有相关关系的两个变量,的几组数据如下表所示:
(1)请根据上表数据在网格纸中绘制散点图;
(2)请根据上表数据,用最小二乘法求出关于的线性回归方程 ,并估计当
,并估计当 时的值.
时的值.
参考公式: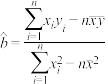 ,
, ,
, ,
,
,的几组数据如下表所示:
| 2 | 4 | 6 | 8 | 10 |
| 3 | 6 | 7 | 10 | 12 |
(2)请根据上表数据,用最小二乘法求出
关于的线性回归方程,并估计当时的值.参考公式:
,,,
您最近一年使用:0次
2021-10-03更新
|
312次组卷
|
3卷引用:新疆新源县2020-2021学年高二下学期期末数学(文)试题
20-21高二·全国·单元测试
名校
解题方法
9 . 某种产品的广告费支出与销售额(单位:百万元)之间有如表对应数据:
参考公式:用最小二乘法求线性回归方程系数公式: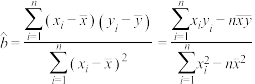 ,
, .
.
(1)画出散点图;
(2)求线性回归方程;
(3)预测当广告费支出7(百万元)时的销售额.
与销售额(单位:百万元)之间有如表对应数据: | 2 | 4 | 5 | 6 | 8 |
| 30 | 40 | 60 | 50 | 70 |
,.(1)画出散点图;
(2)求线性回归方程;
(3)预测当广告费支出7(百万元)时的销售额.
您最近一年使用:0次
2021-10-05更新
|
312次组卷
|
3卷引用:第八章 成对数据的统计分析(提高卷)-《阳光测评》2020-2021学年高二数学单元提升卷(人教A版2019选择性必修第三册)
(已下线)第八章 成对数据的统计分析(提高卷)-《阳光测评》2020-2021学年高二数学单元提升卷(人教A版2019选择性必修第三册)四川省宜宾市第一中学2021-2022学年高二上学期期中联考数学(文)试题四川省宜宾市第一中学2021-2022学年高二上学期期中联考数学(理)试题
名校
解题方法
10 . 为落实国家扶贫攻坚政策,某地区应上级扶贫办的要求,对本地区所有贫困户每年年底进行收入统计,下表是该地区 贫困户从2017年至2020年的收入统计数据:(其中y为贫困户的人均年纯收入)
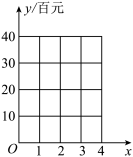
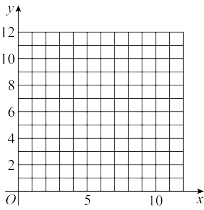
(1)在给定的坐标系中画出A贫困户的人均年纯收入关于年份代码的散点图;
(2)根据上表数据,用最小二乘法求出y关于x的线性回归方程 ,并估计A贫困户在
 年能否脱贫.(注:假定脱贫标准为人均年纯收入不低于
 元)
元)
参考公式: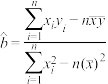 ,
,
参考数据: ,
, .
.
贫困户从2017年至2020年的收入统计数据:(其中y为贫困户的人均年纯收入)| 年份 | 2017年 | 2018年 | 2019年 | 2020年 |
| 年份代码 | 1 | 2 | 3 | 4 |
| 人均年纯收入y/百元 | 25 | 28 | 32 | 35 |
(1)在给定的坐标系中画出A贫困户的人均年纯收入关于年份代码的散点图;
(2)根据上表数据,用最小二乘法求出y关于x的线性回归方程
,并估计A贫困户在年能否脱贫.(注:假定脱贫标准为人均年纯收入不低于元)参考公式:
,参考数据:
,.
您最近一年使用:0次
2022-01-28更新
|
180次组卷
|
2卷引用:陕西省榆林市2021-2022学年高二上学期期末理科数学试题


