某出版社单册图书的成本费y(元)与印刷册数x(千册)有关,经统计得到数据如下:
其中 .
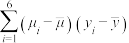
.
(1)根据以上数据画出散点图(可借助统计软件),并根据散点图判断: 与
与 中哪一个适宜作为回归方程模型?
(2)根据(1)的判断结果,试建立成本费y关于印刷册数x的回归方程.
(3)利用回归方程估计印刷26000册图书的单册成本(结果保留两位小数).
| x | 1 | 2 | 3 | 5 | 7 | 10 | 11 | 20 | 25 | 30 |
| y | 9.02 | 5.27 | 4.06 | 3.03 | 2.59 | 2.28 | 2.21 | 1.89 | 1.80 | 1.75 |
 |  |  |  |  |  |  |
| 11.4 | 3.39 | 0.249 | 934.4 | 0.825 | -139.03 | 6.196 |
.(1)根据以上数据画出散点图(可借助统计软件),并根据散点图判断:
与中哪一个适宜作为回归方程模型?(2)根据(1)的判断结果,试建立成本费y关于印刷册数x的回归方程.
(3)利用回归方程估计印刷26000册图书的单册成本(结果保留两位小数).
21-22高二·湖南·课后作业 查看更多[2]
更新时间:2022-03-07 22:21:40
|
相似题推荐
解答题-作图题
|
适中
(0.65)
解题方法
【推荐1】某车间为了规定工时定额,需要确定加工零件所花费的时间,为此做了四次试验,得到的数据如下:
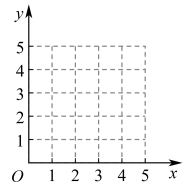
(1)在给定的坐标系中画出表中数据的散点图:
(2)求出 关于
关于 的线性回归方程
 ,并在坐标系中画出回归直线.
(注: ,
, )
)
| 零件的个数(个) | 2 | 3 | 4 | 5 |
| 加工的时间(小时) | 2.5 | 3 | 4 | 4.5 |
(2)求出
关于的线性回归方程,并在坐标系中画出回归直线.(注:
,)
您最近一年使用:0次
解答题-应用题
|
适中
(0.65)
解题方法
【推荐2】某连锁经营公司所属的5个零售店某月的销售额和利润额资料如下表:
(1)画出销售额和利润额的散点图;
(2)若销售额和利润额具有相关关系,用最小二乘法计算利润额y对销售额x的回归直线方程;
(3)据(2)的结果估计当销售额为1亿元时的利润额.
| 商品名称 | A | B | C | D | E |
| 销售额x/千万元 | 3 | 5 | 6 | 7 | 9 |
| 利润额y/百万元 | 2 | 3 | 3 | 4 | 5 |
(2)若销售额和利润额具有相关关系,用最小二乘法计算利润额y对销售额x的回归直线方程;
(3)据(2)的结果估计当销售额为1亿元时的利润额.
您最近一年使用:0次
解答题-应用题
|
适中
(0.65)
名校
解题方法
【推荐3】下表是某厂生产某种产品的过程中记录的几组数据,其中x表示产量(单位:吨),y表示生产中消耗的煤的数量(单位:吨)
(1)试在给出的坐标系下作出散点图,根据散点图判断,在 与
与 中,哪一个方程更适合作为变量y关于x的回归方程模型?(给出判断即可,不需要说明理由)
(2)根据(1)的结果以及表中数据,建立变量y关于x的回归方程.并估计生产100吨产品需要准备多少吨煤.
参考公式: ,
,
| x | 2 | 3 | 4 | 5 | 6 |
| y | 2 | 2.5 | 3.5 | 4.5 | 6.5 |
与中,哪一个方程更适合作为变量y关于x的回归方程模型?(给出判断即可,不需要说明理由)(2)根据(1)的结果以及表中数据,建立变量y关于x的回归方程.并估计生产100吨产品需要准备多少吨煤.
参考公式:
,
您最近一年使用:0次
解答题-问答题
|
适中
(0.65)
【推荐1】下面给出了根据我国2012年~2018年水果人均占有量(单位: )和年份代码绘制的散点图和线性回归方程的残差图(2012年~2018年的年份代码分别为1~7).
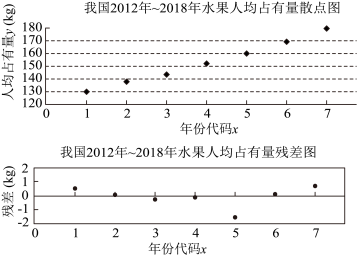
(1)根据散点图分析与之间的相关关系;
(2)根据散点图相应数据计算得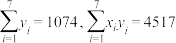 ,求关于的线性回归方程;
(3)根据线性回归方程的残差图,分析线性回归方程的拟合效果.(精确到0.01)
附:回归方程 中斜率和截距的最小二乘估计公式分别为:
 .
.
(单位:)和年份代码绘制的散点图和线性回归方程的残差图(2012年~2018年的年份代码分别为1~7).(1)根据散点图分析
与之间的相关关系;(2)根据散点图相应数据计算得
,求关于的线性回归方程;(3)根据线性回归方程的残差图,分析线性回归方程的拟合效果.(精确到0.01)
附:回归方程
中斜率和截距的最小二乘估计公式分别为:.
您最近一年使用:0次
解答题-应用题
|
适中
(0.65)
名校
解题方法
【推荐2】某科技公司为确定下一年度投入某种产品的研发费,需了解年研发费x(单位:万元)对年销售量y(单位:百件)和年利润(单位:万元)的影响,现对近6年的年研发费 和年销售量
和年销售量 (
( ,2,…,6)数据作了初步处理,得到下面的散点图及一些统计量的值.
表中 ,
, .
.
(1)根据散点图判断与 哪一个更适宜作为年研发费x的回归方程类型;(给出判断即可,不必说明理由)
(2)根据(1)的判断结果及表中数据,建立y关于x的回归方程;
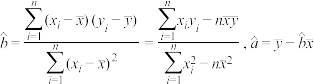
(3)已知这种产品的年利润 ,根据(2)的结果,当年研发费为多少时,年利润z的预报值最大?附:对于一组数据
 ,
, ,…,
,…, ,其回归直线
 的斜率和截距的最小二乘法估计分别为
 ,
, .
.
和年销售量(,2,…,6)数据作了初步处理,得到下面的散点图及一些统计量的值.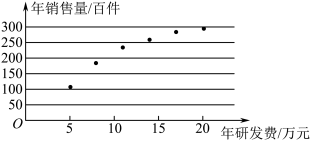
 |  |  |  |  |  |  |  |
| 12.5 | 222 | 3.5 | 157.5 | 16800 | 4.5 | 1254 | 270 |
,.(1)根据散点图判断
与哪一个更适宜作为年研发费x的回归方程类型;(给出判断即可,不必说明理由)(2)根据(1)的判断结果及表中数据,建立y关于x的回归方程;
(3)已知这种产品的年利润
,根据(2)的结果,当年研发费为多少时,年利润z的预报值最大?附:对于一组数据,,…,,其回归直线的斜率和截距的最小二乘法估计分别为,.
您最近一年使用:0次
解答题-问答题
|
适中
(0.65)
名校
解题方法
【推荐3】某公司为确定下一年度投入某种产品的宣传费,需了解年宣传费(单位:千元)对年销售量(单位:吨)的影响,对近 年的年宣传费和年销售量
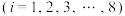 数据作了初步处理,得到下面的散点图及一些统计量的值.
表中: ,
,
(1)根据散点图判断,与 ,哪一个适宜作为年销售量关于年宣传费的回归方程类型(给出判断即可,不必说明理由);
(2)根据(1)的判断结果及表中数据,建立关于的回归方程;
(3)根据(2)中的回归方程,求当年宣传费 千元时,年销售预报值是多少?
附:对于一组数据 ,
, ,…,
,…, ,其回归线
,其回归线 的斜率和截距的最小二乘估计分别为:
 ,
, .
.
(单位:千元)对年销售量(单位:吨)的影响,对近年的年宣传费和年销售量数据作了初步处理,得到下面的散点图及一些统计量的值. | |  |  |  |  |  |
| 46.6 | 563 | 6.8 | 289.8 | 1.6 | 1469 | 108.8 |
表中:
,(1)根据散点图判断,
与,哪一个适宜作为年销售量关于年宣传费的回归方程类型(给出判断即可,不必说明理由);(2)根据(1)的判断结果及表中数据,建立
关于的回归方程;(3)根据(2)中的回归方程,求当年宣传费
千元时,年销售预报值是多少?附:对于一组数据
,,…,,其回归线的斜率和截距的最小二乘估计分别为:,.
您最近一年使用:0次
解答题-问答题
|
适中
(0.65)
名校
解题方法
【推荐1】随着我国经济的发展,居民的储蓄存款逐年增长.某地区城乡居民人民币储蓄存款(年底余额)如下表:
(1)求关于 的回归方程
的回归方程 ;
;
(2)试预测该地区在建国一百周年时的的储蓄存款,并求关于的回归方程.
附: ,
, .
.
| 年份 | 2014 | 2015 | 2016 | 2017 | 2018 |
| 时间代号 | 1 | 2 | 3 | 4 | 5 |
| 储蓄存款(千亿元) | 5 | 6 | 7 | 8 | 9 |
(1)求
关于的回归方程;(2)试预测该地区在建国一百周年时的的储蓄存款,并求
关于的回归方程.附:
,.
您最近一年使用:0次
解答题-应用题
|
适中
(0.65)
【推荐2】某连锁经营公司所属5个零售店某月的销售额和利润额资料如表所示:
(1)画出销售额和利润额的散点图.
(2)若销售额和利润额具有相关关系,用最小二乘法计算利润额y对销售额x的回归直线方程 =
= x+
x+ ,其中=
,其中= ,=
,= -
- .
.
(3)若获得利润是4.5百万元时估计销售额是多少(千万元)?
商店名称 | A | B | C | D | E |
销售额(x)/千万元 | 3 | 5 | 6 | 7 | 9 |
利润额(y)/百万元 | 2 | 3 | 3 | 4 | 5 |
(2)若销售额和利润额具有相关关系,用最小二乘法计算利润额y对销售额x的回归直线方程
=x+,其中=,=-.(3)若获得利润是4.5百万元时估计销售额是多少(千万元)?
您最近一年使用:0次
 的大小判断回收率
 ,并预测当
,并预测当 时回收率
时回收率


 相关关系
相关关系 ,
,
解答题-问答题
|
适中
(0.65)
名校
【推荐1】随着综合国力逐步增强,西北某地区大力兴建防风林带,引水拉沙,引洪淤地,开展了改造沙漠的巨大工程,该地区于2017年投入沙漠治理经费2亿元,从2018年到2020年连续3年每年增加沙漠治理经费1亿元,近4年沙漠治理经费投入(亿元)和沙漠治理面积(万亩)的相关数据如下表所示:
(1)建立关于的线性回归方程;
(2)若保持以往的经费增加幅度,请预测到哪一年沙漠治理面积突破100万亩.
参考公式: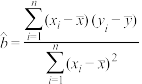 ,
, .
.
(亿元)和沙漠治理面积(万亩)的相关数据如下表所示:年份 | 2017 | 2018 | 2019 | 2020 |
x | 2 | 3 | 4 | 5 |
| 26 | 39 | 49 | 54 |
关于的线性回归方程;(2)若保持以往的经费增加幅度,请预测到哪一年沙漠治理面积突破100万亩.
参考公式:
,.
您最近一年使用:0次
解答题-应用题
|
适中
(0.65)
解题方法
【推荐2】某城市理论预测2015年到2019年人口总数与年份的关系如下表所示
(1)请用相关系数说明该组数据中与之间的关系可用线性回归模型进行拟合;
(2)求出关于的线性回归方程 ;
;
(3)据此估计2021年该城市人口总数.
参考公式:相关系数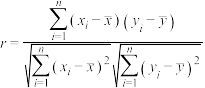 ,对于一组具有线性相关关系的数据
 ,其回归直线的斜率和截距的最小二乘估计分别为
 .
.
年份 | 2015 | 2016 | 2017 | 2018 | 2019 |
时间代号 | 0 | 1 | 2 | 3 | 4 |
人口总数(十万) | 5 | 7 | 8 | 11 | 19 |
与之间的关系可用线性回归模型进行拟合;(2)求出
关于的线性回归方程;(3)据此估计2021年该城市人口总数.
参考公式:相关系数
,对于一组具有线性相关关系的数据,其回归直线的斜率和截距的最小二乘估计分别为.
您最近一年使用:0次
 .
.


