2021·全国·模拟预测
名校
1 . 某研究所为了研究近几年中国留学生回国人数的情况,对2014至2018年留学生回国人数进行了统计,数据如下表:
根据上述统计数据求得留学生回国人数 (单位:万)与年份代码
 满足的线性回归方程为
 ,利用回归方程预测
 年留学生回国人数为( )
年份 | 2014 | 2015 | 2016 | 2017 | 2018 |
年份代码 | 1 | 2 | 3 | 4 | 5 |
留学生回国人数/万 | 36.5 | 40.9 | 43.3 | 48.1 | 51.9 |
根据上述统计数据求得留学生回国人数
(单位:万)与年份代码满足的线性回归方程为,利用回归方程预测年留学生回国人数为( )| A.63.14万 | B.64.72万 | C.66.81万 | D.66.94万 |
您最近一年使用:0次
名校
解题方法
2 . 在一段时间内,分5次调查,得到某种商品的价格(万元)和需求量 之间的一组数据为:
线性回归方程系数公式:b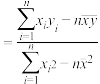 ,
, .
.
(1)画出散点图;
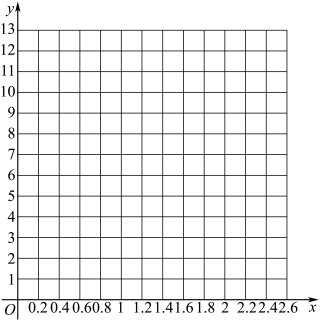
(2)求出关于的线性回归方程y=bx+a;
(3)若价格定为1.9万元,预测需求量大约是多少?(精确到 ).
).
(万元)和需求量之间的一组数据为:1 | 2 | 3 | 4 | 5 | |
价格 | 1.4 | 1.6 | 1.8 | 2 | 2.2 |
需求量 | 12 | 10 | 7 | 5 | 3 |
,.(1)画出散点图;
(2)求出
关于的线性回归方程y=bx+a;(3)若价格定为1.9万元,预测需求量大约是多少?(精确到
).
您最近一年使用:0次
2022-03-24更新
|
106次组卷
|
3卷引用:甘肃省静宁县第一中学2021-2022学年高二上学期第一次月考数学(理)试题
名校
解题方法
3 . 某家庭2015~2019年的年收入和年支出情况统计如表:
(1)已知与具有线性相关关系,求关于的线性回归方程(系数精确到0.01);
(2)假设受新冠肺炎疫情影响,该家庭2021年的年收入为9.5万元,请根据(1)中的线性回归方程预测该家庭2021年的年支出金额.
附:回归方程 中的斜率的最小二乘估计公式为
 .
.
年份收入和支出 | 2015年 | 2016年 | 2017年 | 2018年 | 2019年 |
收入 | 9 | 9.6 | 10 | 10.4 | 11 |
支出 | 7.3 | 7.5 | 8 | 8.5 | 8.7 |
与具有线性相关关系,求关于的线性回归方程(系数精确到0.01);(2)假设受新冠肺炎疫情影响,该家庭2021年的年收入为9.5万元,请根据(1)中的线性回归方程预测该家庭2021年的年支出金额.
附:回归方程
中的斜率的最小二乘估计公式为.
您最近一年使用:0次
2021-10-29更新
|
618次组卷
|
3卷引用:甘肃省张掖市2020-2021学年高一下学期期末数学(理科)试题
名校
4 . 如图是某小区2020年1月至2021年1月当月在售二手房均价(单位:万元/平方米)的散点图.(图中月份代码1~13分别对应2020年1月~2021年1月).根据散点图选择 和
和 两个模型进行拟合,经过数据处理得到两个回归方程分别为
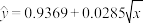 和
和 ,并得到以下一些统计量的值:
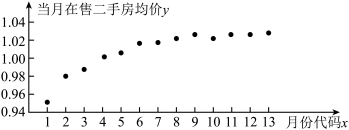
(1)请利用相关指数 判断哪个模型的拟合效果更好;
(2)估计该小区2021年6月份的二手房均价.(精确到 万元/平方米)
参考数据: ,
, ,
, ,
, ,
, ,
, ,
, ,
, .
.
参考公式:相关指数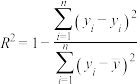 .
.
和两个模型进行拟合,经过数据处理得到两个回归方程分别为和,并得到以下一些统计量的值: | | |
残差平方和 |  |  |
总偏差平方和 |  | |
判断哪个模型的拟合效果更好;(2)估计该小区2021年6月份的二手房均价.(精确到
万元/平方米)参考数据:
,,,,,,,.参考公式:相关指数
.
您最近一年使用:0次
2021-09-16更新
|
852次组卷
|
7卷引用:甘肃省天水市第一中学2021-2022学年高二下学期第一阶段考试数学(理)试题
甘肃省天水市第一中学2021-2022学年高二下学期第一阶段考试数学(理)试题黑龙江省大庆市肇州县2021届高三下学期二校联考数学(文科) 试题(已下线)8.3 统计案例(精练)-【一隅三反】2022年高考数学一轮复习(新高考地区专用)(已下线)第48讲 统计案例-2022年新高考数学二轮专题突破精练(已下线)热点09 成对数据的统计分析-2022年高考数学【热点·重点·难点】专练(全国通用)(已下线)押全国卷(文科)第18题 概率与统计-备战2022年高考数学(文)临考题号押题(全国卷)(已下线)专题25 统计类(解答题)+概率(几何概型)-1
名校
解题方法
5 . 某大型餐饮集团计划在某省会城市开设连锁店,为了确定在该市开设连锁店的个数,该集团对其他省会城市经营情况的数据作了初步处理后得到下列表格.记表示在其他省会城市开设的连锁店的个数,表示这个连锁店的年收入之和.
(1)根据散点图可以认为和存在线性相关,求关于的线性回归方程 ;
;
(2)据(1)的结果,若在该省会城市开设 个连锁店,估计这个连锁店的年收入之和是多少.
附:,其中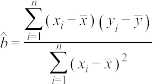 ,
, .
.
表示在其他省会城市开设的连锁店的个数,表示这个连锁店的年收入之和.
|
|
|
|
|
|
|
|
|
|
|
|


 和存在线性相关,求关于的线性回归方程;
(2)据(1)的结果,若在该省会城市开设
个连锁店,估计这个连锁店的年收入之和是多少.附:
,其中,.
您最近一年使用:0次
2021-09-01更新
|
179次组卷
|
2卷引用:甘肃省金昌市永昌县第一高级中学2021-2022学年高二上学期期末数学(理)试题
解题方法
6 . 某连锁经营公司所属5个零售店某月的销售额和利润额资料如下表:
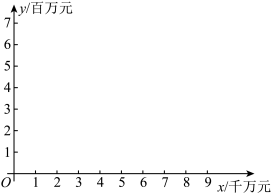
(1)画出散点图,观察散点图,说明两个变量有怎样的相关性;
(2)用最小二乘法计算利润额对销售额的回归直线方程;
(3)当销售额为 (千万元)时,估计利润额的大小.
参考公式: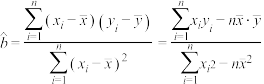 ,
, ,
, ,
,
| 商店名称 |  |  |  |  |  |
| 销售额/千万元 | 3 | 5 | 6 | 7 | 9 |
| 利润额/百万元 | 2 | 3 | 3 | 4 | 5 |
(2)用最小二乘法计算利润额
对销售额的回归直线方程;(3)当销售额为
(千万元)时,估计利润额的大小.参考公式:
,,,
您最近一年使用:0次
名校
7 . 一台还可以用的机器由于使用的时间较长,它按不同的转速生产出来的某机械零件有一些会有缺陷,每小时生产有缺陷零件的多少随机器运转的速率而变化,下表为抽样试验结果:
通过观察散点图,发现与有线性相关关系:
(1)求关于的回归直线方程;
(参考:回归直线方程为,其中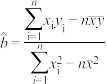 ,
, )
)
(2)若实际生产中,允许每小时生产的产品中有缺陷的零件最多为 个,那么机器的运转速度应控制在什么范围内?
转速 |
|
|
|
|
每小时生产有缺陷的零件数 |
|
|
|
|


 与有线性相关关系:
(1)求
关于的回归直线方程;(参考:回归直线方程为
,其中,)(2)若实际生产中,允许每小时生产的产品中有缺陷的零件最多为
个,那么机器的运转速度应控制在什么范围内?
您最近一年使用:0次
名校
8 . 对两个变量y和x进行回归分析,得到一组样本数据: ,
, ,
, ,
, ,则下列说法中不正确的是( )
,,,,则下列说法中不正确的是( )| A.用相关指数来刻画回归效果,的值越小,说明模型的拟合效果越好 |
B.由样本数据得到的线性回归方程 必过样本点的中心 必过样本点的中心 |
| C.残差平方和越小的模型,拟合的效果越好 |
D.若变量y和x之间的相关系数 ,则变量y与x之间具有线性相关关系 ,则变量y与x之间具有线性相关关系 |
您最近一年使用:0次
2021-08-16更新
|
434次组卷
|
8卷引用:甘肃省金昌市永昌县第一高级中学2021-2022学年高二下学期第一次月考数学(文)试题
甘肃省金昌市永昌县第一高级中学2021-2022学年高二下学期第一次月考数学(文)试题云南省丽江市第一中学2020-2021学年高二3月月考数学(文)试题(已下线)专题13 两个变量的线性相关(重点练)-2020-2021学年高一数学十分钟同步课堂专练(人教A版必修3)(已下线)8.2一元线性回归模型及其应用A卷新疆石河子第一中学2021-2022学年高二下学期4月月考数学(文)试题第七章 统计案例单元检测(B卷)综合篇湖北省武汉市第十一中学2022-2023学年高二下学期6月月考数学试题黑龙江省齐齐哈尔市朝鲜族学校2022-2023学年高二下学期期末数学试题
名校
9 . 已知变量 和满足关系
和满足关系 ,变量与负相关.下列结论中正确的是( )
和满足关系,变量与负相关.下列结论中正确的是( )| A.与正相关,与负相关 |
| B.与正相关,与正相关 |
| C.与负相关,与负相关 |
| D.与负相关,与正相关 |
您最近一年使用:0次
名校
10 . 某考察团对全国10大城市进行职工人均工资水平(千元)与居民人均消费水平(千元)统计调查,与具有相关关系,回归方程为 ,若某城市居民人均消费水平为7.675千元,估计该城市人均消费额占人均工资收入的百分比约为
______ .
(千元)与居民人均消费水平(千元)统计调查,与具有相关关系,回归方程为,若某城市居民人均消费水平为7.675千元,估计该城市人均消费额占人均工资收入的百分比约为
您最近一年使用:0次


