2023·全国·模拟预测
1 . 2015—2019年,中国社会消费品零售额占GDP的比重超过4种,2020年后,中国社会消费品零售额占GDP的比重逐年下降.下表为2018—2022年中国社会消费品零售额(单位:万亿元)及其占GDP的比重y(单位:%)的数据,其中2018—2022年对应的年份代码x依次为1~5.
年份代码x | 1 | 2 | 3 | 4 | 5 |
社会消费品零售额 | 37.8 | 40.8 | 39.2 | 44.1 | 44.0 |
社会消费品零售额占 GDP的比重y/% | 41.3 | 41.5 | 39.0 | 38.6 | 36.7 |
(1)由上表数据,是否可用一元线性回归模型拟合y与x的关系,请用相关系数加以说明.
(2)请建立y关于x的一元线性回归方程.
(3)从2018—2022年中国社会消费品零售额这5个数据中随机抽取2个数据.若抽取的2个数据中至少有1个数据大于40.0,求这2个数据恰好有1个数据不小于44.0的概率.
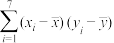
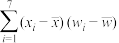
附: ,
, ,
, ,
, ,
,
相关系数 .
.
对于一组数据 ,其一元线性回归直线
 的斜率和截距的最小二乘估计公式分别为
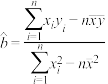 ,
, .
.
您最近一年使用:0次
2023-11-20更新
|
921次组卷
|
5卷引用:第02讲 8.2 一元线性回归模型及其应用(知识清单+6类热点题型精讲+强化分层精练)-【帮课堂】2023-2024学年高二数学同步学与练(人教A版2019选择性必修第三册)
(已下线)第02讲 8.2 一元线性回归模型及其应用(知识清单+6类热点题型精讲+强化分层精练)-【帮课堂】2023-2024学年高二数学同步学与练(人教A版2019选择性必修第三册)(已下线)2024年普通高等学校招生全国统一考试·信息卷理科数学(三)(已下线)第十章 重难专攻(十三) 概率与统计的综合问题(讲)(已下线)高考2024年普通高等学校招生全国统一考试?信息卷数学(六)(已下线)第二篇 “搞定”解答题前3个 专题3 概率统计解答题【练】 高三逆袭之路突破90分
名校
2 . 已知变量x,y呈线性相关关系,回归方程为 ,且变量x,y的样本数据如下表所示
据此计算出在 时,预测值为-0.2,则m的值为( )
,且变量x,y的样本数据如下表所示x | -2 | -1 | 0 | 1 | 2 |
y | 5 | 4 | m | 2 | 1 |
时,预测值为-0.2,则m的值为( )| A.3 | B.2.8 | C.2 | D.1 |
您最近一年使用:0次
2023-11-18更新
|
654次组卷
|
4卷引用:重庆市巴蜀中学2024届高考适应性月考卷(四)(期中)数学试题
重庆市巴蜀中学2024届高考适应性月考卷(四)(期中)数学试题(已下线)第02讲 8.2 一元线性回归模型及其应用(知识清单+6类热点题型精讲+强化分层精练)-【帮课堂】2023-2024学年高二数学同步学与练(人教A版2019选择性必修第三册)(已下线)8.2 一元线性回归模型及其应用——课堂例题重庆市渝西中学2023-2024学年高二下学期6月月考数学试题
名校
解题方法
3 . 当前,新一轮科技革命和产业变革蓬勃兴起,以区块链为代表的新一代信息技术迅猛发展,现收集某地近6年区块链企业总数量相关数据,如下表:
(1)若用模型 拟合
拟合 与
与 的关系,根据提供的数据,求出与的经验回归方程;
(2)为了促进公司间的合作与发展,区块链联合总部决定进行一次信息化技术比赛,邀请甲、乙、丙三家区块链公司参赛.比赛规则如下:①每场比赛有两个公司参加,并决出胜负;②每场比赛获胜的公司与未参加此场比赛的公司进行下一场的比赛;③在比赛中,若有一个公司首先获胜两场,则本次比赛结束,该公司获得此次信息化比赛的“优胜公司”.已知在每场比赛中,甲胜乙的概率为 ,甲胜丙的概率为
 ,乙胜丙的概率为
 ,若首场由甲乙比赛,求甲公司获得“优胜公司”的概率.
参考数据: ,其中,
,其中,
参考公式:对于一组数据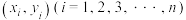 ,其经验回归直线
 的斜率和截距的最小二乘估计分别为
| 年份 | 2017 | 2018 | 2019 | 2020 | 2021 | 2022 |
| 编号 | 1 | 2 | 3 | 4 | 5 | 6 |
| 企业总数量(单位:百个) | 50 | 78 | 124 | 121 | 137 | 352 |
拟合与的关系,根据提供的数据,求出与的经验回归方程;(2)为了促进公司间的合作与发展,区块链联合总部决定进行一次信息化技术比赛,邀请甲、乙、丙三家区块链公司参赛.比赛规则如下:①每场比赛有两个公司参加,并决出胜负;②每场比赛获胜的公司与未参加此场比赛的公司进行下一场的比赛;③在比赛中,若有一个公司首先获胜两场,则本次比赛结束,该公司获得此次信息化比赛的“优胜公司”.已知在每场比赛中,甲胜乙的概率为
,甲胜丙的概率为,乙胜丙的概率为,若首场由甲乙比赛,求甲公司获得“优胜公司”的概率.参考数据:
,其中,参考公式:对于一组数据
,其经验回归直线的斜率和截距的最小二乘估计分别为
您最近一年使用:0次
2023-11-09更新
|
1103次组卷
|
6卷引用:第八章 成对数据的统计分析(知识归纳+题型突破)-2023-2024学年高二数学单元速记·巧练(沪教版2020选择性必修第二册)
(已下线)第八章 成对数据的统计分析(知识归纳+题型突破)-2023-2024学年高二数学单元速记·巧练(沪教版2020选择性必修第二册)陕西省西安市西安中学2024届高三模拟考试(九)数学(理科)试题重庆市渝中区2024届高三上学期期中数学试题(已下线)重难专攻(十三) 概率与统计的综合问题(核心考点集训)(已下线)第三节 成对数据的统计分析(第一课时)一轮复习点点通(已下线)专题13 统计(5大易错点分析+解题模板+举一反三+易错题通关)-2
名校
解题方法
4 . 中国茶文化博大精深,饮茶深受大众喜爱,茶水的口感与茶叶类型和水的温度有关,某数学建模小组为了获得茶水温度y(单位: )关于时间x(单位:min)的回归方程模型,通过实验收集在
 室温,用同一温度的水冲泡的条件下,茶水温度随时间变化的7组数据,并对数据做初步处理得到如图所示散点图以及如表所示数据.
表中: ,
,
(1)根据散点图判断,① 与②
与② 哪一个更适宜作为该茶水温度y关于时间x的回归方程类型?(给出判断即可,不必说明理由)请根据你的判断结果及表中数据建立该茶水温度y关于时间x的回归方程;
(2)已知该茶水温度降至 口感最佳,根据(1)中的回归方程,求在相同条件下冲泡的茶水,大约需要放置多长时间才能达到最佳饮用口感?
附:(1)对于一组数据 ,…,
,…, ,其回归直线
 的斜率和截距的最小二乘估计分别为
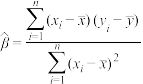 ,
,
(2)参考数据: ,
, ,
, ,
, ,
,
)关于时间x(单位:min)的回归方程模型,通过实验收集在室温,用同一温度的水冲泡的条件下,茶水温度随时间变化的7组数据,并对数据做初步处理得到如图所示散点图以及如表所示数据.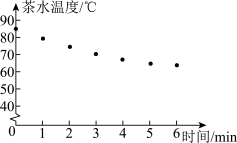
 |  |  |  |
| 73.5 | 3.85 |  |  |
,(1)根据散点图判断,①
与②哪一个更适宜作为该茶水温度y关于时间x的回归方程类型?(给出判断即可,不必说明理由)请根据你的判断结果及表中数据建立该茶水温度y关于时间x的回归方程;(2)已知该茶水温度降至
口感最佳,根据(1)中的回归方程,求在相同条件下冲泡的茶水,大约需要放置多长时间才能达到最佳饮用口感?附:(1)对于一组数据
,…,,其回归直线的斜率和截距的最小二乘估计分别为,(2)参考数据:
,,,,
您最近一年使用:0次
2023-10-27更新
|
1174次组卷
|
8卷引用:【数学建模】茶水最佳饮用时间
(已下线)【数学建模】茶水最佳饮用时间(已下线)第八章 成对数据的统计分析(知识归纳+题型突破)-2023-2024学年高二数学单元速记·巧练(沪教版2020选择性必修第二册)(已下线)第04讲 拓展一:数学建模 建立统计模型进行预测(非线性回归模型)-【帮课堂】2023-2024学年高二数学同步学与练(人教A版2019选择性必修第三册)(已下线)9.1 线性回归分析(2)(已下线)8.2.1一元线性回归模型+8.2.2一元线性回归模型 第三练 能力提升拔高(已下线)专题05 一元线性回归模型与独立性检验常考题型归类--高二期末考点大串讲(人教B版2019选择性必修第二册)广东省广州市执信中学2024届高三上学期第二次月考数学试题(已下线)专题13 统计(5大易错点分析+解题模板+举一反三+易错题通关)-2
解题方法
5 . 云南省统计局发布《全省旅游业发展情况(2015-2022年)》报告,其中2015年至2022年游客总人数y(单位:亿人次)的数据如下表:
为了预测2023年云南省游客总人数,根据2015年至2022年游客总人数y的数据建立线性回归模型一,得到回归方程 :
: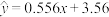 ,但由于受到2020年疫情影响,估计预测不准确,若用2015年至2019年数据建立线性回归模型二,得到回归方程
 :
:
(1)根据和预测2023年云南省游客总人数(预测数据精确到0.1);
(2)为了检验两种模型的预测效果,对两种模型作残差分析得到:
模型一:总偏差平方和 ,残差平方和
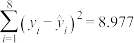 ;
;
模型二:总偏差平方和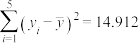 ,残差平方和
 ,
,
用 来比较模型一与模型二的拟合效果(精确到0.001);
(3)根据2020年至2022年游客总人数y的数据建立线性回归模型三,求回归方程 ,并根据预测2023年云南省游客总人数(预测数据精确到0.1).
参考公式: ,
, ,,.
,,.
年份 | 2015 | 2016 | 2017 | 2018 | 2019 | 2020 | 2021 | 2022 |
年份代号x | 1 | 2 | 3 | 4 | 5 | 6 | 7 | 8 |
游客总人数y | 3.3 | 4.3 | 5.7 | 6.9 | 8.1 | 5.3 | 6.5 | 8.4 |
:,但由于受到2020年疫情影响,估计预测不准确,若用2015年至2019年数据建立线性回归模型二,得到回归方程:(1)根据
和预测2023年云南省游客总人数(预测数据精确到0.1);(2)为了检验两种模型的预测效果,对两种模型作残差分析得到:
模型一:总偏差平方和
,残差平方和;模型二:总偏差平方和
,残差平方和,用
来比较模型一与模型二的拟合效果(精确到0.001);(3)根据2020年至2022年游客总人数y的数据建立线性回归模型三,求回归方程
,并根据预测2023年云南省游客总人数(预测数据精确到0.1).参考公式:
,,,.
您最近一年使用:0次
2023-10-07更新
|
346次组卷
|
5卷引用:第八章 成对数据的统计分析(单元重点综合测试)(19题新结构)-2023-2024学年高二数学单元速记·巧练(人教A版2019选择性必修第三册)
(已下线)第八章 成对数据的统计分析(单元重点综合测试)(19题新结构)-2023-2024学年高二数学单元速记·巧练(人教A版2019选择性必修第三册)(已下线)第02讲 8.2 一元线性回归模型及其应用(知识清单+6类热点题型精讲+强化分层精练)-【帮课堂】2023-2024学年高二数学同步学与练(人教A版2019选择性必修第三册)(已下线)8.2 一元线性回归模型及其应用——课后作业(巩固版)云南省昆明市第二十四中学2024届高三上学期月考数学试题(一)(已下线)第三节 成对数据的统计分析(第一课时)(核心考点集训)一轮复习点点通
6 . 对于数据组 ,如果由经验回归方程得到的对应自变量
 的估计值是
的估计值是 ,那么将
,那么将 称为对应点
称为对应点 的残差.某商场为了给一种新商品进行合理定价,将该商品按事先拟定的价格进行试销,得到如下所示数据:
根据表中的数据,得到销量(单位:件)与单价(单位:元)之间的经验回归方程为 ,据计算,样本点
 处的残差为
处的残差为 ,则
,则
___________ .
,如果由经验回归方程得到的对应自变量的估计值是,那么将称为对应点的残差.某商场为了给一种新商品进行合理定价,将该商品按事先拟定的价格进行试销,得到如下所示数据:单价 | 8.2 | 8.4 | 8.6 | 8.8 |
销量 | 84 | 83 | 78 | m |
 元
元 件(单位:件)与单价(单位:元)之间的经验回归方程为,据计算,样本点处的残差为,则
您最近一年使用:0次
2023-10-07更新
|
1099次组卷
|
10卷引用:8.2.1一元线性回归模型练习
8.2.1一元线性回归模型练习(已下线)考点16 回归模型 2024届高考数学考点总动员【练】(已下线)专题04 回归分析与独立性检验的应用(四大类型)(已下线)第05讲 第八章 成对数据的统计分析 章末重点题型大总结-【帮课堂】2023-2024学年高二数学同步学与练(人教A版2019选择性必修第三册)(已下线)9.1 线性回归分析(3)吉林省长春市绿园区长春市文理高中2023-2024学年高二下学期4月月考数学试题(已下线)8.2.1一元线性回归模型+8.2.2一元线性回归模型 第一课 解透课本内容(已下线)专题04 第八章 成对数据的统计分析--高二期末考点大串讲(人教A版2019)河南省郑州市中牟县第二高级中学2022-2023学年高二下学期第四次月考数学试题(已下线)第三节 成对数据的统计分析(第一课时)一轮复习点点通
解题方法
7 . 一个车间为了估计加工某种新型零件所花费的时间,进行了10次试验,测得的数据如下:
(1)y与x之间是否具有相关关系?
(2)如果y与x之间具有相关关系,求回归直线方程.
(3)据此估计加工110个零件所用的时间.
零件个数x | 10 | 20 | 30 | 40 | 50 | 60 | 70 | 80 | 90 | 100 |
加工时间y/min | 62 | 68 | 75 | 81 | 89 | 95 | 102 | 108 | 115 | 122 |
(2)如果y与x之间具有相关关系,求回归直线方程.
(3)据此估计加工110个零件所用的时间.
您最近一年使用:0次
2023-10-05更新
|
173次组卷
|
3卷引用:8.2.1一元线性回归模型练习
8.2.1一元线性回归模型练习(已下线)第05讲 第八章 成对数据的统计分析 章末重点题型大总结-【帮课堂】2023-2024学年高二数学同步学与练(人教A版2019选择性必修第三册)湘教版(2019)选择性必修第二册课本例题4.2.2 一元线性回归模型的应用
解题方法
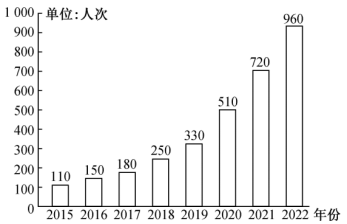
8 . 如图是M市某爱国主义教育基地宣传栏中标题为“2015~2022年基地接待青少年人次”的统计图.根据该统计图提供的信息解决下列问题.
①参考数据:
| 0 | 1 | 2 | 3 |
|
|
| 90 | 330 |


②参考公式:对于一组数据 ,其回归直线的斜率和截距的最小二乘法公式分别为:
 .
.
(1)求M市爱国主义教育基地所统计的8年中接待青少年人次的平均值和中位数;
(2)由统计图可看出,从2019年开始,M市爱国主义教育基地接待青少年的人次呈直线上升趋势,请你用线性回归分析的方法预测2024年基地接待青少年的人次.
您最近一年使用:0次
名校
9 . 数学兴趣小组对具有线性相关的两个变量x和y进行了统计分析,得到了下表:
x | 4 | 6 | 8 | 10 | 12 |
y | a | 2 | b | c | 6 |
并由表中数据求得y关于x的回归方程为 ,若a,b,c成等差数列,则
您最近一年使用:0次
2023-09-19更新
|
766次组卷
|
9卷引用:8.2.1一元线性回归模型练习
8.2.1一元线性回归模型练习(已下线)考点16 回归模型 2024届高考数学考点总动员(已下线)第八章 成对数据的统计分析(单元重点综合测试)(19题新结构)-2023-2024学年高二数学单元速记·巧练(人教A版2019选择性必修第三册)(已下线)专题04 回归分析与独立性检验的应用(四大类型)(已下线)第八章 成对数据的统计分析(知识归纳+题型突破)-2023-2024学年高二数学单元速记·巧练(沪教版2020选择性必修第二册)陕西省西安市第八十三中学等校2023届高三二轮复习联考(一)文科数学试题(已下线)第三节 成对数据的统计分析(第一课时) B卷素养养成卷 一轮复习点点通黑龙江省牡丹江市第三高级中学2024届高三上学期第三次月考数学试题山东省潍坊市实验中学2024届高三上学期12月周测数学试题
23-24高二上·上海·课后作业
解题方法
10 . 某连锁日用品销售公司下属5个社区便利店某月的销售额与利润额如下表所示.
(1)绘制销售额和利润额的散点图;
(2)若销售额和利润额具有线性相关关系,试计算利润额y与销售额x的经验回归直线方程.
| 便利店编号 | 1 | 2 | 3 | 4 | 5 |
| 销售额x/万元 | 30 | 60 | 45 | 80 | 89 |
| 利润额y/万元 | 2.3 | 3.5 | 3.2 | 4.0 | 5.3 |
(2)若销售额和利润额具有线性相关关系,试计算利润额y与销售额x的经验回归直线方程.
您最近一年使用:0次
2023-09-12更新
|
268次组卷
|
5卷引用:第八章 成对数据的统计分析(知识归纳+题型突破)-2023-2024学年高二数学单元速记·巧练(沪教版2020选择性必修第二册)
(已下线)第八章 成对数据的统计分析(知识归纳+题型突破)-2023-2024学年高二数学单元速记·巧练(沪教版2020选择性必修第二册)(已下线)8.2 一元线性回归模型及其应用(分层练习,7大题型)-2023-2024学年高二数学同步精品课堂(人教A版2019选择性必修第三册)(已下线)8.2 一元线性回归模型及其应用——课后作业(提升版)(已下线)复习题(八)(已下线)第七章 统计案例(单元基础检测卷)-2023-2024学年高二数学同步精品课堂(北师大版2019选择性必修第一册)


