1 . 近期济南公交公司分别推出支付宝和微信扫码支付乘车活动,活动设置了一段时间的推广期,由于推广期内优惠力度较大,吸引越来越多的人开始使用扫码支付.某线路公交车队统计了活动刚推出一周内每一天使用扫码支付的人次,用 表示活动推出的天数,
  表示每天使用扫码支付的人次(单位:十人次),统计数据如表
 所示:
所示:

根据以上数据,绘制了散点图.
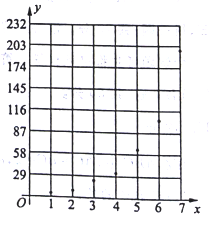
(1)根据散点图判断,在推广期内, 与
与 (
( 均为大于零的常数)哪一个适宜作为扫码支付的人次关于活动推出天数的回归方程类型?(给出判断即可,不必说明理由);
(2)根据(1)的判断结果及表中的数据,建立关于的回归方程,并预测活动推出第 天使用扫码支付的 人次;
(3)推广期结束后,为更好的服务乘客,车队随机调查了 人次的乘车支付方式,得到如下结果:
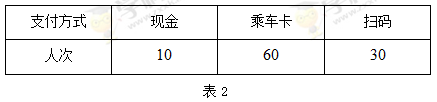
已知该线路公交车票价 元,使用现金支付的乘客无优惠,使用乘车卡支付的乘客享受折优惠,扫码支付的乘客随机优惠,根据调查结果发现:使用扫码支付的乘客中有
 名乘客享受
名乘客享受 折优惠,有
折优惠,有 名乘客享受折优惠,有
 名乘客享受
名乘客享受 折优惠.预计该车队每辆车每个月有1万人次乘车,根据所给数据,以事件发生的频率作为相应事件发生的概率,在不考虑其他因素的条件下,按照上述收费标准,试估计该车队一辆车一年的总收入.
参考数据:
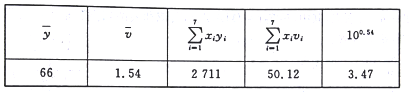
其中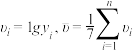
参考公式:
对于一组数据 ,其回归直线
 的斜率和截距的最小二乘估计公式分别为:

表示活动推出的天数, 表示每天使用扫码支付的人次(单位:十人次),统计数据如表所示:根据以上数据,绘制了散点图.
(1)根据散点图判断,在推广期内,
与(均为大于零的常数)哪一个适宜作为扫码支付的人次关于活动推出天数的回归方程类型?(给出判断即可,不必说明理由);(2)根据(1)的判断结果及表
中的数据,建立关于的回归方程,并预测活动推出第天使用扫码支付的 人次;(3)推广期结束后,为更好的服务乘客,车队随机调查了
人次的乘车支付方式,得到如下结果:已知该线路公交车票价
元,使用现金支付的乘客无优惠,使用乘车卡支付的乘客享受折优惠,扫码支付的乘客随机优惠,根据调查结果发现:使用扫码支付的乘客中有名乘客享受折优惠,有名乘客享受折优惠,有名乘客享受折优惠.预计该车队每辆车每个月有1万人次乘车,根据所给数据,以事件发生的频率作为相应事件发生的概率,在不考虑其他因素的条件下,按照上述收费标准,试估计该车队一辆车一年的总收入.参考数据:
其中
参考公式:
对于一组数据
,其回归直线的斜率和截距的最小二乘估计公式分别为:
您最近一年使用:0次
名校
解题方法
2 . “双十一”期间,某淘宝店主对其商品的上架时间(小时)和销售量(件)的关系作了统计,得到了如下数据并研究.
(1)求表中销售量的平均数和中位数;
(2)① 作出散点图,并判断变量与是否线性相关?若研究的方案是先根据前5组数据求线性回归方程,再利用第6组数据进行检验,求线性回归方程 ;
;
②若根据①中线性回归方程得到商品上架12小时的销售量的预测值与检测值不超过3件,则认为得到的线性回归方程是理想的,试问:①中的线性回归方程是否理想.
附:线性回归方程中,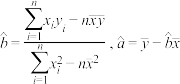 .
.
(小时)和销售量(件)的关系作了统计,得到了如下数据并研究.上架时间 | 2 | 4 | 6 | 8 | 10 | 12 |
销售量 | 64 | 138 | 205 | 285 | 360 | 430 |
的平均数和中位数;(2)① 作出散点图,并判断变量
与是否线性相关?若研究的方案是先根据前5组数据求线性回归方程,再利用第6组数据进行检验,求线性回归方程;②若根据①中线性回归方程得到商品上架12小时的销售量的预测值与检测值不超过3件,则认为得到的线性回归方程是理想的,试问:①中的线性回归方程是否理想.
附:线性回归方程
中,.
您最近一年使用:0次
2018-04-17更新
|
598次组卷
|
3卷引用:2018年普通高校招生全国卷 I A 信息卷 高三文科数学(二)
名校
3 . 某公司的广告费支出x与销售额y(单位:万元)之间有下列对应数据
(1)画出散点图,并判断广告费与销售额是否具有相关关系;
(2)根据表中提供的数据,用最小二乘法求出y与x的回归方程 ;
;
(3)预测销售额为115万元时,大约需要多少万元广告费.
参考公式:回归方程为 其中
其中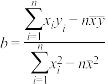 ,
, 
| x | 2 | 4 | 5 | 6 | 8 |
| y | 30 | 40 | 60 | 50 | 70 |
(1)画出散点图,并判断广告费与销售额是否具有相关关系;
(2)根据表中提供的数据,用最小二乘法求出y与x的回归方程
;(3)预测销售额为115万元时,大约需要多少万元广告费.
参考公式:回归方程为
其中,
您最近一年使用:0次
2019-01-30更新
|
1319次组卷
|
2卷引用:2015-2016学年广东省清远市一中实验学校高二上学期期中数学试卷
4 . 基于移动互联技术的共享单车被称为“新四大发明”之一,短时间内就风靡全国,带给人们新的出行体验.某共享单车运营公司的市场研究人员为了解公司的经营状况,对该公司最近六个月内的市场占有率进行了统计,结果如下表:
(1)请在给出的坐标纸中作出散点图,并用相关系数说明可用线性回归模型拟合月度市场占有率与月份代码之间的关系;
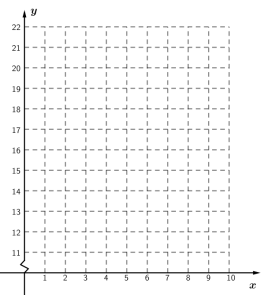
(2)求关于的线性回归方程,并预测该公司2018年2月份的市场占有率;
(3)根据调研数据,公司决定再采购一批单车扩大市场,现有采购成本分别为1000元/辆和800元/辆的 两款车型报废年限各不相同.考虑到公司的经济效益,该公司决定先对两款单车各100辆进行科学模拟测试,得到两款单车使用寿命频数表如下:
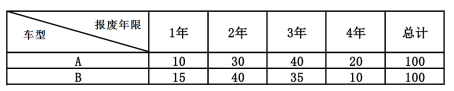
经测算,平均每辆单车每年可以为公司带来收入500元.不考虑除采购成本之外的其他成本,假设每辆单车的使用寿命都是整数年,且用频率估计每辆单车使用寿命的概率,以每辆单车产生利润的期望值为决策依据.如果你是该公司的负责人,你会选择采购哪款车型?
参考数据: ,
, ,
, .
.
参考公式:相关系数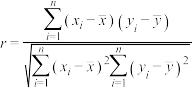 ;
;
回归直线方程为,其中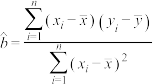 ,
, .
.
月份 | 2017.8 | 2017.9 | 2017.10 | 2017.11 | 2017.12 | 2018.1 |
月份代码 | 1 | 2 | 3 | 4 | 5 | 6 |
市场占有率 | 11 | 13 | 16 | 15 | 20 | 21 |
 与月份代码之间的关系;
(2)求
关于的线性回归方程,并预测该公司2018年2月份的市场占有率;(3)根据调研数据,公司决定再采购一批单车扩大市场,现有采购成本分别为1000元/辆和800元/辆的
两款车型报废年限各不相同.考虑到公司的经济效益,该公司决定先对两款单车各100辆进行科学模拟测试,得到两款单车使用寿命频数表如下:经测算,平均每辆单车每年可以为公司带来收入500元.不考虑除采购成本之外的其他成本,假设每辆单车的使用寿命都是整数年,且用频率估计每辆单车使用寿命的概率,以每辆单车产生利润的期望值为决策依据.如果你是该公司的负责人,你会选择采购哪款车型?
参考数据:
,,.参考公式:相关系数
;回归直线方程为
,其中,.
您最近一年使用:0次
名校
解题方法
5 . 已知鸡的产蛋量与鸡舍的温度有关,为了确定下一个时段鸡舍的控制温度,某企业需要了解鸡舍的温度 (单位: ),对某种鸡的时段产蛋量(单位:
 ) 和时段投入成本
 (单位:万元)的影响,为此,该企业收集了7个鸡舍的时段控制温度
 和产蛋量
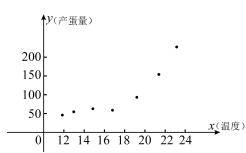
和产蛋量 的数据,对数据初步处理后得到了如图所示的散点图和表中的统计量的值.
其中 .
.
(1)根据散点图判断, 与
与 哪一个更适宜作为该种鸡的时段产蛋量关于鸡舍时段控制温度的回归方程类型?(给判断即可,不必说明理由)
(2)若用 作为回归方程模型,根据表中数据,建立关于的回归方程;
(3)已知时段投入成本与 的关系为
的关系为 ,当时段控制温度为
 时,鸡的时段产蛋量及时段投入成本的预报值分别是多少?
附:①对于一组具有线性相关关系的数据 ,其回归直线
 的斜率和截距的最小二乘估计分别为
 ,
, .
.
(单位:),对某种鸡的时段产蛋量(单位:) 和时段投入成本(单位:万元)的影响,为此,该企业收集了7个鸡舍的时段控制温度和产蛋量的数据,对数据初步处理后得到了如图所示的散点图和表中的统计量的值.
|
|
|
|
|
|
|
|
|
| 140 |
|
|
|


 .
.(1)根据散点图判断,
与哪一个更适宜作为该种鸡的时段产蛋量关于鸡舍时段控制温度的回归方程类型?(给判断即可,不必说明理由)(2)若用
作为回归方程模型,根据表中数据,建立关于的回归方程;(3)已知时段投入成本
与的关系为,当时段控制温度为时,鸡的时段产蛋量及时段投入成本的预报值分别是多少?附:①对于一组具有线性相关关系的数据
,其回归直线的斜率和截距的最小二乘估计分别为,.
|
|
|
|
|
0.08 | 0.47 | 2.72 | 20.09 | 1096.63 |


您最近一年使用:0次
2018-02-17更新
|
2542次组卷
|
3卷引用:湖北省荆州中学、宜昌一中等“荆、荆、襄、宜四地七校考试联盟”2018届高三2月联考数学(文)试题2
名校
6 . 某公司为了研究年宣传费(单位:千元)对销售量(单位:吨)和年利润(单位:千元)的影响,搜集了近 8 年的年宣传费和年销售量 数据:
数据:
(1)请补齐表格中 8 组数据的散点图,并判断与 中哪一个更适宜作为年销售量关于年宣传费的函数表达式?(给出判断即可,不必说明理由)

(2)若(1)中的 ,且产品的年利润与,的关系为
 ,为使年利润值最大,投入的年宣传费应为何值?
(单位:千元)对销售量(单位:吨)和年利润(单位:千元)的影响,搜集了近 8 年的年宣传费和年销售量数据: | 1 | 2 | 3 | 4 | 5 | 6 | 7 | 8 |
| 38 | 40 | 44 | 46 | 48 | 50 | 52 | 56 |
| 45 | 55 | 61 | 63 | 65 | 66 | 67 | 68 |
(1)请补齐表格中 8 组数据的散点图,并判断
与中哪一个更适宜作为年销售量关于年宣传费的函数表达式?(给出判断即可,不必说明理由)(2)若(1)中的
,且产品的年利润与,的关系为,为使年利润值最大,投入的年宣传费应为何值?
您最近一年使用:0次
2018-02-11更新
|
215次组卷
|
2卷引用:福建省泉州市2017-2018学年高一上学期期末考试数学试题
名校
解题方法
7 . 随着我国经济的快速发展,民用汽车的保有量也迅速增长.机动车保有量的发展影响到环境质量、交通安全、道路建设等诸多方面.在我国,尤其是大中型城市,机动车已成为城市空气污染的重要来源.因此,合理预测机动车保有量是未来进行机动车污染防治规划、道路发展规划等的重要前提.从2012年到2016年,根据“云南省某市国民经济和社会发展统计公报”中公布的数据,该市机动车保有量数据如表所示.
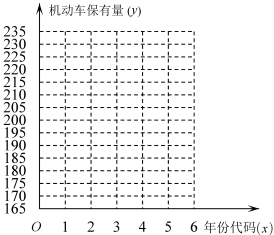
(1)在图所给的坐标系中作出数据对应的散点图;
附注:回归直线方程 中的斜率和截距的最小二乘估计公式分别为:
 ,
, .
.
(2)建立机动车保有量关于年份代码的回归方程;
(3)按照当前的变化趋势,预测2017年该市机动车保有量.
年份 | 2012 | 2013 | 2014 | 2015 | 2016 |
年份代码 | 1 | 2 | 3 | 4 | 5 |
机动车保有量 | 169 | 181 | 196 | 215 | 230 |
(1)在图所给的坐标系中作出数据对应的散点图;
附注:回归直线方程
中的斜率和截距的最小二乘估计公式分别为:,.(2)建立机动车保有量
关于年份代码的回归方程;(3)按照当前的变化趋势,预测2017年该市机动车保有量.
您最近一年使用:0次
2017-12-22更新
|
740次组卷
|
2卷引用:云南省师范大学附属中学2018届高三12月高考适应性月考卷(五)数学(理)试题
解题方法
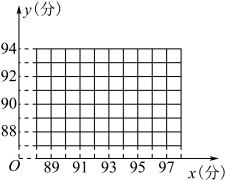
8 . 一次考试中,五位学生的数学,物理成绩如下表所示:
(1)要从5名学生中选2人参加一项活动,求选中的学生中至少有一人的物理成绩高于90分的概率;
(2)根据上表数据,画出散点图并用散点图说明物理成绩与数学成绩之间线性相关关系的强弱,如果具有较强的线性相关关系,求与的线性回归方程(系数精确到0.01);如果不具有线性相关关系,请说明理由.
参考公式:
回归直线的方程是 ,其中
,其中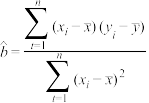 ,,
,,
参考数据: ,
, .
.
学生 | A1 | A2 | A3 | A4 | A5 |
数学成绩x(分) | 93 | 97 | 89 | 95 | 91 |
物理成绩y(分) | 89 | 93 | 87 | 92 | 89 |
(2)根据上表数据,画出散点图并用散点图说明物理成绩
与数学成绩之间线性相关关系的强弱,如果具有较强的线性相关关系,求与的线性回归方程(系数精确到0.01);如果不具有线性相关关系,请说明理由.参考公式:
回归直线的方程是
,其中,,参考数据:
,.
您最近一年使用:0次
名校
解题方法
9 . 下表提供了某厂节能降耗技术改造后生产甲产品过程中记录的产量(吨)与相应的生产能耗(吨)标准煤的几组对照数据:
(1)请画出上表数据的散点图;
(2)请根据上表提供的数据,用最小二乘法求出关于的线性回归方程 ;
;
(3)已知该厂技术改造前100吨甲产品能耗为200吨标准煤,试根据(2)求出的线性回归方程,预测生产100吨甲产品的生产能耗比技术改造前降低多少吨标准煤?
吨)与相应的生产能耗(吨)标准煤的几组对照数据:
| 1 | 2 | 3 | 4 | 5 |
| 2 | 3 | 6 | 9 | 10 |
(2)请根据上表提供的数据,用最小二乘法求出
关于的线性回归方程; (3)已知该厂技术改造前100吨甲产品能耗为200吨标准煤,试根据(2)求出的线性回归方程,预测生产100吨甲产品的生产能耗比技术改造前降低多少吨标准煤?
您最近一年使用:0次
解题方法
10 . 某车间为了规定工时定额,需要确定加工零件所花费的时间,为此做了四次试验,得到的数据如下:
(1)在给定的坐标系中画出表中数据的散点图:
(2)求出关于的线性回归方程,并在坐标系中画出回归直线.
(注: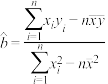 ,
, )
)
| 零件的个数(个) | 2 | 3 | 4 | 5 |
| 加工的时间(小时) | 2.5 | 3 | 4 | 4.5 |
(2)求出
关于的线性回归方程,并在坐标系中画出回归直线.(注:
,)
您最近一年使用:0次
2017-11-07更新
|
886次组卷
|
2卷引用:黑龙江省和吉林省九校2017学年高二上学期期中考试数学(文)试题


