名校
1 . 随着人们经济收入的不断增长,个人购买家庭轿车已不再是一种时尚车的使用费用,尤其是随着使用年限的增多,所支出的费用到底会增长多少,一直是购车一族非常关心的问题某汽车销售公司作了一次抽样调查,并统计得出某款车的使用年限 与所支出的总费用
 (万元)有如表的数据资料:
(1) 在给出的坐标系中作出散点图;
(2)求线性回归方程 中的
中的 、
、 ;
;
(3)估计使用年限为 年时,车的使用总费用是多少?
(最小二乘法求线性回归方程系数公式 ,
,  .)
.)
与所支出的总费用(万元)有如表的数据资料:| 使用年限 | 2 | 3 | 4 | 5 | 6 |
| 总费用 | 2.2 | 3.8 | 5.5 | 6.5 | 7.0 |
(1) 在给出的坐标系中作出散点图;
(2)求线性回归方程
中的、;(3)估计使用年限为
年时,车的使用总费用是多少?(最小二乘法求线性回归方程系数公式
, .)
您最近一年使用:0次
2019-04-28更新
|
548次组卷
|
6卷引用:【全国百强校】广东省佛山市第一中学2018-2019学年高二下学期第一次月考数学(文)试题
2 . 某工厂为了对新研发的一种产品进行合理定价,将该产品按事先拟定的价格进行试销,得到如下数据:
(1) 请根据上表提供的数据画出散点图,并判断是正相关还是负相关;
(2) 求出关于的回归直线方程,若单价为9元时,预测其销量为多少?
(参考公式:回归直线方程中公式 ,
, )
)
| 单价(元) | 4 | 6 | 7 | 8 | 10 |
| 销量(件) | 60 | 50 | 45 | 30 | 20 |
(1) 请根据上表提供的数据画出散点图,并判断是正相关还是负相关;
(2) 求出
关于的回归直线方程,若单价为9元时,预测其销量为多少?(参考公式:回归直线方程中公式
,)
您最近一年使用:0次
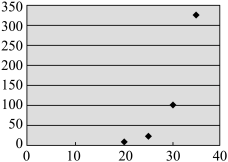
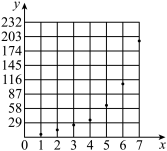
3 . 一只红铃虫的产卵数和温度有关,现收集了4组观测数据列于下表中,根据数据作出散点图如下:
(1)根据散点图判断 与
与 哪一个更适宜作为产卵数关于温度的回归方程类型?(给出判断即可,不必说明理由)
(2)根据(1)的判断结果及表中数据,建立关于的回归方程(数字保留2位小数);
(3)要使得产卵数不超过50,则温度控制在多少 以下?(最后结果保留到整数)
参考数据: ,
, ,
, ,
, ,
, ,
, ,
, ,
, ,
, ,
, ,
,
和温度有关,现收集了4组观测数据列于下表中,根据数据作出散点图如下:温度 | 20 | 25 | 30 | 35 |
| 产卵数/个 | 5 | 20 | 100 | 325 |
(1)根据散点图判断
与哪一个更适宜作为产卵数关于温度的回归方程类型?(给出判断即可,不必说明理由)(2)根据(1)的判断结果及表中数据,建立
关于的回归方程(数字保留2位小数);(3)要使得产卵数不超过50,则温度控制在多少
以下?(最后结果保留到整数)参考数据:
,,,,,,,,,, | 5 | 20 | 100 | 325 |
 | 1.61 | 3 | 4.61 | 5.78 |
您最近一年使用:0次
2019-01-22更新
|
1543次组卷
|
5卷引用:【市级联考】广东省清远市2019届高三上学期期末考试数学(理)试题
4 . 某班主任为了对本班学生的月考成绩进行分析,从全班40名同学中随机抽取一个容量为6的样本进行分析.随机抽取6位同学的数学、物理分数对应如表:
(1)根据上表数据用散点图说明物理成绩y与数学成绩x之间是否具有线性相关性?
(2)如果具有线性相关性,求出线性回归方程(系数精确到0.1);如果不具有线性相关性,请说明理由.
(3)如果班里的某位同学数学成绩为50,请预测这位同学的物理成绩.
 (附
(附 )
)
学生编号 | 1 | 2 | 3 | 4 | 5 | 6 |
数学分数x | 60 | 70 | 80 | 85 | 90 | 95 |
物理分数y | 72 | 80 | 88 | 90 | 85 | 95 |
(2)如果具有线性相关性,求出线性回归方程(系数精确到0.1);如果不具有线性相关性,请说明理由.
(3)如果班里的某位同学数学成绩为50,请预测这位同学的物理成绩.
(附)
您最近一年使用:0次
2019-01-19更新
|
273次组卷
|
3卷引用:【全国百强校】黑龙江省大庆铁人中学2018-2019学年高二上学期期末考试数学(理)试题
【全国百强校】黑龙江省大庆铁人中学2018-2019学年高二上学期期末考试数学(理)试题黑龙江省大庆铁人中学2018-2019学年高二上学期期末考试数学(理)试题(已下线)第07章:统计案例(B卷提升篇)-2020-2021学年高二数学下学期同步单元AB卷(苏教版)
名校
5 . 某公司为确定下一年度投入某种产品的宣传费,需了解年宣传费x(单位:千元)对年销售量y(单位:t)和年利润z(单位:千元)的影响.对近8年的年宣传费xi和年销售量yi(i=1,2,…,8)数据作了初步处理,得到下面的散点图及一些统计量的值.
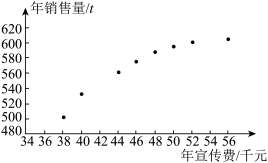
表中 ,
,
(Ⅰ)根据散点图判断,y=a+bx与y=c+d 哪一个适宜作为年销售量y关于年宣传费x的回归方程类型?(给出判断即可,不必说明理由)
(Ⅱ)根据(Ⅰ)的判断结果及表中数据,建立y关于x的回归方程;
(Ⅲ)已知这种产品的年利润z与x、y的关系为z=0.2y-x.根据(Ⅱ)的结果回答下列问题:
附:对于一组数据 ,
, ,……,
,……, ,其回归线
,其回归线 的斜率和截距的最小二乘估计分别为:
 ,
,
表中
,(Ⅰ)根据散点图判断,y=a+bx与y=c+d
哪一个适宜作为年销售量y关于年宣传费x的回归方程类型?(给出判断即可,不必说明理由)(Ⅱ)根据(Ⅰ)的判断结果及表中数据,建立y关于x的回归方程;
(Ⅲ)已知这种产品的年利润z与x、y的关系为z=0.2y-x.根据(Ⅱ)的结果回答下列问题:
(ⅰ)年宣传费x=49时,年销售量及年利润的预报值是多少?
(ⅱ)年宣传费x为何值时,年利润的预报值最大?
附:对于一组数据
,,……,,其回归线的斜率和截距的最小二乘估计分别为: |  |  |  |  |  |  |
| 46.6 | 563 | 6.8 | 289.8 | 1.6 | 1469 | 108.8 |
,
您最近一年使用:0次
名校
6 . 假设关于某设备的使用年限x(年)和所支出的维修费用y(万元)有如下的统计资料:
(1)画出散点图并判断是否线性相关;
(2)如果线性相关,求线性回归方程;
(3)估计使用年限为10年时,维修费用是多少?
| x | 2 | 3 | 4 | 5 | 6 |
| y | 2.2 | 3.8 | 5.5 | 6.5 | 7.0 |
(2)如果线性相关,求线性回归方程;
(3)估计使用年限为10年时,维修费用是多少?
您最近一年使用:0次
2019-01-17更新
|
221次组卷
|
4卷引用:模块检测-2018-2019版数学创新设计课堂讲义同步系列(湘教版必修5)
名校
7 . 越接近高考学生焦虑程度越强,四个高三学生中大约有一个有焦虑症,经有关机构调查,得出距离高考周数与焦虑程度对应的正常值变化情况如下表:
(1)作出散点图:
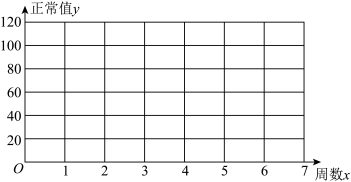
(2)根据上表数据用最小二乘法求出y关于x的线性回归方程 (精确到0.01);
(3)根据经验,观测值为正常值的0.85~1.06为正常,若1.06~1.12为轻度焦虑,1.12~1.20为中度焦虑,1.20及其以上为重度焦虑,若为中度焦虑及其以上,则要进行心理疏导,若一个学生在距高考第二周时观测值为100,则该学生是否需要进行心理疏导?
( ,
,  )
)
| 周数x | 6 | 5 | 4 | 3 | 2 | 1 |
| 正常值y | 55 | 63 | 72 | 80 | 90 | 99 |
(1)作出散点图:
(2)根据上表数据用最小二乘法求出y关于x的线性回归方程 (精确到0.01);
(3)根据经验,观测值为正常值的0.85~1.06为正常,若1.06~1.12为轻度焦虑,1.12~1.20为中度焦虑,1.20及其以上为重度焦虑,若为中度焦虑及其以上,则要进行心理疏导,若一个学生在距高考第二周时观测值为100,则该学生是否需要进行心理疏导?
(
, )
您最近一年使用:0次
解题方法
8 . 某公交公司分别推出支付宝和微信扫码支付乘车活动,活动设置了一段时间的推广期,由于推广期内优惠力度较大,吸引越来越多的人开始使用扫码支付.某线路公交车队统计了活动刚推出一周内每一天使用扫码支付的人次,用表示活动推出的天数,表示每天使用扫码支付的人次(单位:十人次),统计数据如表所示:
根据以上数据,绘制了散点图.
(1)根据散点图判断,在推广期内, 与
与 (
( ,
, 均为大于零的常数)哪一个适宜作为扫码支付的人次关于活动推出天数的回归方程类型?(给出判断即可,不必说明理由);
(2)若关于的回归方程不是线性的可通过换元方法把它化归为线性回归方程.例如: (
( 为常数,
为常数, 为自然对数的底数),可以两边同时取自然对数
 ,再令
,再令 ,先用最小二乘法求出
 与的线性回归方程,再得出与的回归方程.根据(1)的判断结果及表格提供的数据,求关于的回归方程;
(3)由(2)中的回归方程预测活动推出第 天使用扫码支付的人次.
参考数据:
其中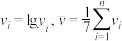 ,参考公式:对于一组数据
 ,
, ,…,
,…, ,其回归直线
 的斜率和截距的最小二乘估计公式分别为:
 ,
, .
.
表示活动推出的天数,表示每天使用扫码支付的人次(单位:十人次),统计数据如表所示:
| 1 | 2 | 3 | 4 | 5 | 6 | 7 |
| 6 | 11 | 21 | 34 | 66 | 101 | 196 |
(1)根据散点图判断,在推广期内,
与(,均为大于零的常数)哪一个适宜作为扫码支付的人次关于活动推出天数的回归方程类型?(给出判断即可,不必说明理由);(2)若
关于的回归方程不是线性的可通过换元方法把它化归为线性回归方程.例如:(为常数,为自然对数的底数),可以两边同时取自然对数,再令,先用最小二乘法求出与的线性回归方程,再得出与的回归方程.根据(1)的判断结果及表格提供的数据,求关于的回归方程;(3)由(2)中的回归方程预测活动推出第
天使用扫码支付的人次.参考数据:
|
|
|
|
|
66 | 1.54 | 2711 | 50.12 | 3.47 |


 ,参考公式:对于一组数据,,…,,其回归直线的斜率和截距的最小二乘估计公式分别为:,.
您最近一年使用:0次
名校
9 . 某种蔬菜从1月1日起开始上市,通过市场调查,得到该蔬菜种植成本 (单位:元/
 )与上市时间
 (单位:10天)的数据如下表:
(1)根据上表数据,从下列函数: ,
, ,
, ,
, 中(其中
中(其中 ),选取一个合适的函数模型描述该蔬菜种植成本与上市时间的变化关系;
(2)利用你选取的函数模型,求该蔬菜种植成本最低时的上市时间及最低种植成本.
(单位:元/)与上市时间(单位:10天)的数据如下表:时间 | 5 | 11 | 25 |
种植成本 | 15 | 10.8 | 15 |
,,,中(其中),选取一个合适的函数模型描述该蔬菜种植成本与上市时间的变化关系;(2)利用你选取的函数模型,求该蔬菜种植成本最低时的上市时间及最低种植成本.
您最近一年使用:0次
2019-02-09更新
|
691次组卷
|
4卷引用:【市级联考】山东省滨州市2018-2019学年高一上学期期末考试数学试题
名校
解题方法
10 . 一商场对每天进店人数和商品销售件数进行了统计对比,得到如下表格:
(1)在给定的坐标系中画出表中数据的散点图,并由散点图判断销售件数与进店人数是否线性相关?(给出判断即可,不必说明理由)
(2)建立关于的回归方程(系数精确到0.01),预测进店人数为80时,商品销售的件数(结果保留整数).
参考数据: ,
, ,
, ,
, ,
, ,
, .
.
参考公式:回归方程 ,其中
,其中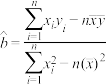 ,
, .
.
(1)在给定的坐标系中画出表中数据的散点图,并由散点图判断销售件数
与进店人数是否线性相关?(给出判断即可,不必说明理由)(2)建立
关于的回归方程(系数精确到0.01),预测进店人数为80时,商品销售的件数(结果保留整数).参考数据:
,,,,,.参考公式:回归方程
,其中,.
您最近一年使用:0次
2018-10-26更新
|
1254次组卷
|
2卷引用:【省级联考】四川省高2019届高三第一次诊断性测试(理科)数学


