解题方法
1 . 下表是某工厂每月生产的一种核心产品的产量 (件)与相应的生产成本
 (万元)的四组对照数据.
| 4 | 6 | 8 | 10 |
| 12 | 20 | 28 | 84 |
(1)试建立
 与的线性回归方程;
(2)研究人员进一步统计历年的销售数据发现.在供销平衡的条件下,市场销售价格会波动变化.经分析,每件产品的销售价格
 (万元)是一个与产量相关的随机变量,分布为
|
|
|
|
|
|
|
|


假设产品月利润=月销售量×销售价格 成本.(其中月销售量=生产量)
根据(1)进行计算,当产量为何值时.月利润的期望值最大?最大值为多少?
您最近一年使用:0次
名校
2 . 一场始于烟火,归于真诚的邂逅,让无数人赴山赶海“进淄赶烤”,淄博某烧烤店趁机推出150元烧烤套餐.某同学调研发现,烧烤店成本(单位:千元,包含人工成本、原料成本、场地成本、设备损耗等各类成本)与每天卖出套餐数(单位:份)的关系如下:
与可用回归方程 (其中
(其中 为常数)进行模拟.
参考数据与公式:设 ,则线性回归直线
 中,
中, .
.
(1)试预测该烧烤店一天卖出100份的利润是多少元.(利润=售价-成本,结果精确到1元)
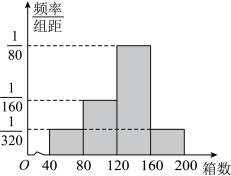
(2)据统计,由于烧烤的火爆,饮料需求也激增.4月份的连续16天中某品牌饮料每天为淄博配送的箱数的频率分布直方图,用这16天的情况来估计相应的概率.供货商拟购置 辆小货车专门运输该品牌饮料,一辆货车每天只能运营一趟,每辆车每趟最多只能装载40箱该饮料,满载发车,否则不发车.若发车,则每辆车每趟可获利500元;若未发车,则每辆车每天平均亏损200元.若
 或4,请从每天的利润期望角度给出你的建议.
(单位:千元,包含人工成本、原料成本、场地成本、设备损耗等各类成本)与每天卖出套餐数(单位:份)的关系如下:
| 1 | 3 | 4 | 6 | 7 |
| 5 | 6.5 | 7 | 7.5 | 8 |
与可用回归方程(其中为常数)进行模拟.参考数据与公式:设
,则线性回归直线中,.
|
|
|
|
0.54 | 6.8 | 1.53 | 0.45 |


(2)据统计,由于烧烤的火爆,饮料需求也激增.4月份的连续16天中某品牌饮料每天为淄博配送的箱数的频率分布直方图,用这16天的情况来估计相应的概率.供货商拟购置
辆小货车专门运输该品牌饮料,一辆货车每天只能运营一趟,每辆车每趟最多只能装载40箱该饮料,满载发车,否则不发车.若发车,则每辆车每趟可获利500元;若未发车,则每辆车每天平均亏损200元.若或4,请从每天的利润期望角度给出你的建议.
您最近一年使用:0次
解题方法
3 . 某连锁便利店从 年到
年到 年销售商品品种为
 种,从
种,从 年开始,该便利店进行了全面升级,销售商品品种为
 种.下表中列出了从年到
 年的利润额.
(1)若某年的利润额超过 万元,则该便利店当年会被评选为示范店;若利润额不超过万元,则该便利店当年不会被评选为示范店.试完成
 列联表,并判断商品品种数量与便利店是否为示范店有关?(显著性水平
 ,
, )
)
(2)请根据年至年(剔除 年的数据)的数据建立与的线性回归模型①;根据年至年的数据建立与的线性回归模型②.分别用这两个模型,预测
 年该便利店的利润额并说明这样的预测值是否可靠?(回归系数精确到
 ,利润精确到
 万元)
万元)
年到年销售商品品种为种,从年开始,该便利店进行了全面升级,销售商品品种为种.下表中列出了从年到年的利润额.年份 |
|
|
|
|
|
|
|
|
|
|
利润额
|
|
|
|
|
|
|
|
|
|
|


(1)若某年的利润额超过
万元,则该便利店当年会被评选为示范店;若利润额不超过万元,则该便利店当年不会被评选为示范店.试完成列联表,并判断商品品种数量与便利店是否为示范店有关?(显著性水平,)品种为 | 品种为 | 总计 | |
被评为示范店次数 | |||
未被评为示范店次数 | |||
总计 |
(2)请根据
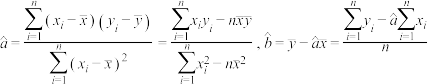
年至年(剔除年的数据)的数据建立与的线性回归模型①;根据年至年的数据建立与的线性回归模型②.分别用这两个模型,预测年该便利店的利润额并说明这样的预测值是否可靠?(回归系数精确到,利润精确到万元)回归系数 与
与 的公式如下:
您最近一年使用:0次
2023高三·全国·专题练习
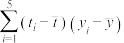
4 . 某专营店统计了近五年来该店的创收利润y(单位:万元)与时间 (单位:年)的相关数据,列表如下:
依据表中给出的数据,是否可用线性回归模型拟合y与t的关系?请计算相关系数r并加以说明(计算结果精确到0.01,若 ,则认为y与t高度相关,可用线性回归模型拟合y与t的关系).
(单位:年)的相关数据,列表如下:
| 1 | 2 | 3 | 4 | 5 |
| 2.4 | 2.7 | 4.1 | 6.4 | 7.9 |
 ,则认为y与t高度相关,可用线性回归模型拟合y与t的关系).
您最近一年使用:0次


