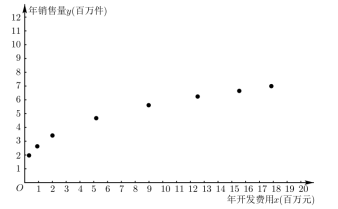
某企业为确定在2019年度投入某种产品的开发费用,需了解年开发费用 (单位:百万元)对年销售量
 (单位:百万件)的影响,统计了近8年投入的年开发费用
 与年销售量
与年销售量 (
(
 )的数据,得到如下散点图.根据散点图可得年开发费用和年销售量符合
 (其中
(其中 为大于0的常数)的回归方程.
(1)对数据作如下处理: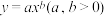 ,两边取对数得
 ,令
,令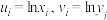 ,得到相关统计量的值如下表,求关于的回归方程;
(2)已知企业年利润 (单位:百万元)与
 的关系为
的关系为 (其中
(其中 )根据(1)的结果,要使得该企业2019年的年利润最大,预计2019年应投入多少开发费用?
附:对于一组数据 ,
, ,
, ,
, ,其回归直线
 的斜率和截距的最小二乘估计分别为
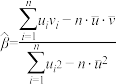 ,
,  .
.
(单位:百万元)对年销售量(单位:百万件)的影响,统计了近8年投入的年开发费用与年销售量()的数据,得到如下散点图.根据散点图可得年开发费用和年销售量符合(其中为大于0的常数)的回归方程. (1)对数据作如下处理:
,两边取对数得,令,得到相关统计量的值如下表,求关于的回归方程;
|
|
|
|
24.40 | 12 | 12 | 37.20 |


 (单位:百万元)与的关系为(其中)根据(1)的结果,要使得该企业2019年的年利润最大,预计2019年应投入多少开发费用?
附:对于一组数据
,,,,其回归直线的斜率和截距的最小二乘估计分别为, .
更新时间:2022-03-31 08:00:19
|
相似题推荐
解答题-问答题
|
适中
(0.65)
【推荐1】已知函数 .
.
(1)求曲线 在点
在点 处的切线方程;
(2)求 的最大值与最小值.
.(1)求曲线
在点处的切线方程;(2)求
的最大值与最小值.
您最近一年使用:0次
解答题-问答题
|
适中
(0.65)
【推荐2】已知函数 .
.
(1)求 的导函数;
的导函数;
(2)求的单调区间;
(3)若在区间 上的最大值为20,求它在该区间上的最小值.
.(1)求
的导函数;(2)求
的单调区间;(3)若
在区间上的最大值为20,求它在该区间上的最小值.
您最近一年使用:0次
解答题-问答题
|
适中
(0.65)
名校
解题方法
【推荐3】已知函数 .
.
(1)当 时,求f(x)的最小值;
(2)设 为整数,且对于任意正整数
 ,
, ,求的最小值.
.(1)当
时,求f(x)的最小值;(2)设
为整数,且对于任意正整数,,求的最小值.
您最近一年使用:0次
解答题-问答题
|
适中
(0.65)
名校
【推荐1】某企业积极响应“碳达峰”号召,研发出一款性能优越的新能源汽车,备受消费者青睐.该企业为了研究新能源汽车在某地区每月销售量(单位:千辆)与月份的关系,统计了今年前5个月该地区的销售量,得到下面的散点图及一些统计量的值.
表中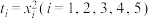 .
.
(1)根据散点图判断两变量的关系用 与
与 哪一个比较合适?(给出判断即可,不必说明理由)
(2)根据(1)的判断结果及表中数据,建立关于的回归方程( 的值精确到
的值精确到 ),并预测从今年几月份起该地区的月销售量不低于
 万辆?
万辆?
附:对于一组数据 ,其回归直线方程
 的斜率和截距的最小二乘法估计分别为
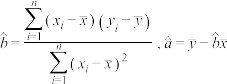 .
.
(单位:千辆)与月份的关系,统计了今年前5个月该地区的销售量,得到下面的散点图及一些统计量的值.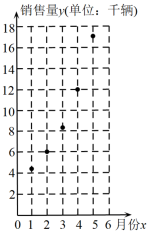
 |  |  |
 |  |  |
.(1)根据散点图判断两变量
的关系用与哪一个比较合适?(给出判断即可,不必说明理由)(2)根据(1)的判断结果及表中数据,建立
关于的回归方程(的值精确到),并预测从今年几月份起该地区的月销售量不低于万辆?附:对于一组数据
,其回归直线方程的斜率和截距的最小二乘法估计分别为.
您最近一年使用:0次
解答题-应用题
|
适中
(0.65)
【推荐2】某企业生产一种产品,从流水线上随机抽取 件产品,统计其质量指标值并绘制频率分布直方图(如图1):规定产品的质量指标值在
 的为劣质品,在
 的为优等品,在
 的为特优品,销售时劣质品每件亏损
 元,优等品每件盈利
 元,特优品每件盈利
 元,以这件产品的质量指标值位于各区间的频率代替产品的质量指标值位于该区间的概率.

(1)求每件产品的平均销售利润;
(2)该企业主管部门为了解企业年营销费用(单位:万元)对年销售量(单位:万件)的影响,对该企业近 年的年营销费用和年销售量,
 数据做了初步处理,得到的散点图(如图2)及一些统计量的值.
表中 ,
, ,
, ,
, .
.
根据散点图判断, 可以作为年销售量(万件)关于年营销费用(万元)的回归方程.
①求关于的回归方程;
②用所求的回归方程估计该企业每年应投入多少营销费,才能使得该企业的年收益的预报值达到最大?(收益 销售利润
销售利润 营销费用,取
 )
)
附:对于一组数据 ,
, ,
, ,
, ,其回归直线
 的斜率和截距的最小二乘估计分别为
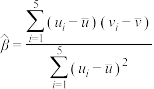 ,
, .
.
件产品,统计其质量指标值并绘制频率分布直方图(如图1):规定产品的质量指标值在的为劣质品,在的为优等品,在的为特优品,销售时劣质品每件亏损元,优等品每件盈利元,特优品每件盈利元,以这件产品的质量指标值位于各区间的频率代替产品的质量指标值位于该区间的概率.(1)求每件产品的平均销售利润;
(2)该企业主管部门为了解企业年营销费用
(单位:万元)对年销售量(单位:万件)的影响,对该企业近年的年营销费用和年销售量,数据做了初步处理,得到的散点图(如图2)及一些统计量的值. |  |  |  |
 |  |  |  |
,,,.根据散点图判断,
可以作为年销售量(万件)关于年营销费用(万元)的回归方程.①求
关于的回归方程;②用所求的回归方程估计该企业每年应投入多少营销费,才能使得该企业的年收益的预报值达到最大?(收益
销售利润营销费用,取)附:对于一组数据
,,,,其回归直线的斜率和截距的最小二乘估计分别为,.
您最近一年使用:0次
解答题-证明题
|
适中
(0.65)
解题方法
【推荐3】我市物价监督部门为调研某公司新开发上市的一种产品销售价格的合理性,对该公司的产品的销售与价格进行了统计分析,得到如下数据和散点图:
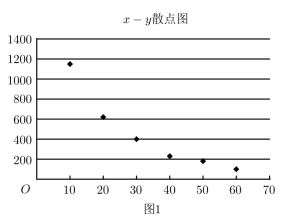

图①为 散点图,图②为
 散点图.
散点图.
(1)根据散点图判断与,与哪一对具有较强的线性相关性(不必证明);
(2)根据(1)的判断结果和参考数据,建立关于的回归方程(线性回归方程中的斜率和截距均保留两位有效数字);
(3)定价为多少时,年销售额的预报值最大?(注:年销售额定价 年销售)
年销售)
参考数据: ,
, ,
, ,
, ,
, ,
,  ,
, ,
, ,
,
参考公式: ,
, .
.
定价 | 10 | 20 | 30 | 40 | 50 | 60 |
年销售 | 1150 | 643 | 424 | 262 | 165 | 86 |
| 14.1 | 12.9 | 12.1 | 11.1 | 10.2 | 8.9 |
 )
)

图①为
散点图,图②为散点图.(1)根据散点图判断
与,与哪一对具有较强的线性相关性(不必证明);(2)根据(1)的判断结果和参考数据,建立
关于的回归方程(线性回归方程中的斜率和截距均保留两位有效数字);(3)定价为多少时,年销售额的预报值最大?(注:年销售额
定价年销售)参考数据:
,,,,, ,,,参考公式:
,.
您最近一年使用:0次


