1 . 在推动电子制造业高质量发展的大环境下,某企业统筹各类资源,进行了积极的改革探索.下表是该企业每月生产的一种核心产品的产量 (件)与相应的生产总成本
 (万元)的四组对照数据.
企业研究人员建立了与 的两种回归模型,利用计算机算得近似结果如下:
经验回归方程①: ;经验回归方程②:
 .
.
其中经验回归方程①的残差图如图所示(残差 观测值
观测值 预测值):关于的回归方程,并说明理由;
(2)从该企业在过去几年生产的该产品中随机抽取100件,优等品有60件,合格品有40件.每件优等品利润为20万元,每件合格品利润为15万元.若视频率为概率,该企业某月计划生产12件该产品,记优等品件数为 ,总利润为
,总利润为 .
.
(ⅰ)求与的关系式,并求 和
和 ;
;
(ⅱ)记该月的成本利润率 ,在(1)中选择的经验回归方程下,求的估计值.(结果保留2位小数)
附:成本利润率 .
.
(件)与相应的生产总成本(万元)的四组对照数据. | 5 | 7 | 9 | 11 |
| 200 | 298 | 431 | 609 |
与的两种回归模型,利用计算机算得近似结果如下:经验回归方程①:
;经验回归方程②:.其中经验回归方程①的残差图如图所示(残差
观测值预测值): 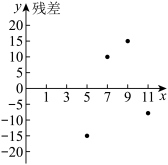
关于的回归方程,并说明理由; | 5 | 7 | 9 | 11 |
| 200 | 298 | 431 | 609 |
 |
(2)从该企业在过去几年生产的该产品中随机抽取100件,优等品有60件,合格品有40件.每件优等品利润为20万元,每件合格品利润为15万元.若视频率为概率,该企业某月计划生产12件该产品,记优等品件数为
,总利润为.(ⅰ)求
与的关系式,并求和;(ⅱ)记该月的成本利润率
,在(1)中选择的经验回归方程下,求的估计值.(结果保留2位小数)附:成本利润率
.
您最近一年使用:0次
解题方法
2 . 乒乓球运动在我国非常普及,被定为“国球”.有非常多的青少年从小就接受系统的训练,所以基本功非常扎实,把乒乓球打到对方球台的指定位置是乒乓球运动的基本功之一,打100个球,若有大于90个打到对方球台的指定位置,则称为“优秀”,否则称为“一般”,在练球时,打球动作有“规范动作”和“不规范动作”两种,且在接受训练的学员中,将训练满10次而不满20次记为1组,训练满20次而不满30次记为2组,如此, ,训练满
,训练满 次而不满
次而不满 次记为
次记为 组.某乒乓球训练部门为了以后优化训练,在“规范动作”和“不规范动作”的两群体中,在组数15组中各随机抽取10人,即两群体中各抽取50人,进行测试得出的关于“优秀”、“一般”的表1和表2如下.表1:
有“规范动作”的学员测试结果(“优秀”个数)
表2:有“不规范动作”的学员测试结果(“优秀”个数)
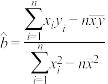
(1)填写以下表格,依据小概率值 的独立性检验分析,推断“优秀”和“一般”与练球时的“规范动作”是否有关.
(2)在有“规范动作”的学员测试结果中,表示组数,表示“优秀”个数,由表1求平均值 和
和 及关于的经验回归方程
 .
.
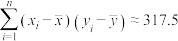
参考数据及公式: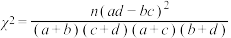 ,
, .
.
 ,
, ,
, ,
, .
.
,训练满次而不满次记为组.某乒乓球训练部门为了以后优化训练,在“规范动作”和“不规范动作”的两群体中,在组数15组中各随机抽取10人,即两群体中各抽取50人,进行测试得出的关于“优秀”、“一般”的表1和表2如下.表1:有“规范动作”的学员测试结果(“优秀”个数)
| 组数 | 1 | 2 | 3 | 4 | 5 |
| “优秀”数 | 1 | 2 | 4 | 6 | 7 |
| 组数 | 1 | 2 | 3 | 4 | 5 |
| “优秀”数 | 0 | 1 | 2 | 3 | 4 |
的独立性检验分析,推断“优秀”和“一般”与练球时的“规范动作”是否有关.| “优秀” | “一般” | 合计 | |
| “规范动作” | 50 | ||
| “不规范动作” | 50 | ||
| 合计 |
表示组数,表示“优秀”个数,由表1求平均值和及关于的经验回归方程.参考数据及公式:
,. | 0.15 | 0.10 | 0.05 | 0.025 | 0.010 | 0.005 | 0.001 |
 | 2.072 | 2.706 | 3.841 | 5.024 | 6.635 | 7.879 | 10.828 |
,,,.
您最近一年使用:0次
名校
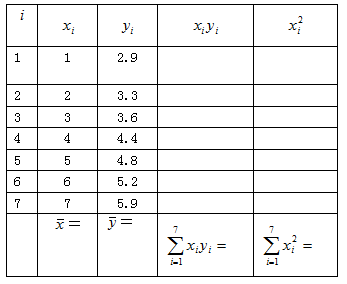
3 . 有一户农村居民家庭实施10年收入计划,从第 1年至7年他家的纯收入y(单位:千元)的数据如下表:
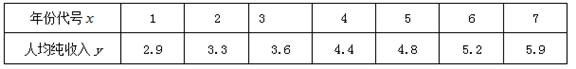
(1)将题中表填写完整,并求关于的线性回归方程;
(2)利用(1)中的回归方程,分析1年至7年该农户家庭人均纯收入的变化情况,并预测该农户第8年的家庭人均纯收入是多少.
附:回归直线的斜率和截距的最小二乘法估计公式分别为:

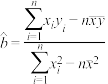 ,
, 
(1)将题中表填写完整,并求
关于的线性回归方程;(2)利用(1)中的回归方程,分析1年至7年该农户家庭人均纯收入的变化情况,并预测该农户第8年的家庭人均纯收入是多少.
附:回归直线的斜率和截距的最小二乘法估计公式分别为:
,
您最近一年使用:0次
解题方法
4 . 植物生长调节剂是一种对植物的生长发育有调节作用的化学物质,它在生活中的应用非常广泛.例如,在蔬菜贮藏前或者贮藏期间,使用一定浓度的植物生长调节剂,可抑制萌芽,保持蔬菜新鲜,延长贮藏期.但在蔬菜上残留的一些植物生长调节剂会损害人体健康.某机构研发了一种新型植物生长调节剂A,它能延长种子、块茎的休眠,进而达到抑制萌芽的作用.为了测试它的抑制效果,高三某班进行了一次数学建模活动,研究该植物生长调节剂A对甲种子萌芽的具体影响,通过实验,收集到A的浓度u( )与甲种子发芽率Y的数据.
表(一)
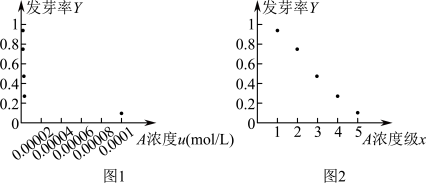
若直接采用实验数据画出散点图,(如图1所示)除了最后一个数据点外,其他各数据点均紧临坐标轴,这样的散点图给我们观察数据背后的规律造成很大的障碍,为了能够更好的观察现有数据,将其进行等价变形是一种有效的途径,通过统计研究我们引进一个中间量x,令 ,通过,将A浓度变量变换为A的浓度级变量,得到新的数据.
表(二)
(1)如图2所示新数据的散点图,散点的分布呈现出很强的线性相关特征.请根据表中数据,建立Y关于x的经验回归方程 ;
;
(2)根据得到的经验回归方程,要想使得甲种子的发芽率不高于0.4,估计A浓度至少要达到多少?
附:对于一组数据 ,…,
,…, ,其经验回归方程
 中斜率和截距的最小二乘估计公式分别为:
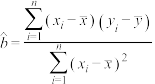 ,.
,.
)与甲种子发芽率Y的数据.表(一)
| A浓度u() |  |  |  |  |  |
| 发芽率Y | 0.94 | 0.76 | 0.46 | 0.24 | 0.10 |
若直接采用实验数据画出散点图,(如图1所示)除了最后一个数据点外,其他各数据点均紧临坐标轴,这样的散点图给我们观察数据背后的规律造成很大的障碍,为了能够更好的观察现有数据,将其进行等价变形是一种有效的途径,通过统计研究我们引进一个中间量x,令
,通过,将A浓度变量变换为A的浓度级变量,得到新的数据.表(二)
| A浓度u() | | | | | |
| A浓度级x | 1 | 2 | 3 | 4 | 5 |
| 发芽率Y | 0.94 | 0.76 | 0.46 | 0.24 | 0.10 |
;(2)根据得到的经验回归方程,要想使得甲种子的发芽率不高于0.4,估计A浓度至少要达到多少
?附:对于一组数据
,…,,其经验回归方程中斜率和截距的最小二乘估计公式分别为:,.
您最近一年使用:0次
2023-03-10更新
|
1298次组卷
|
3卷引用:河北省石家庄市2023届高三质量检测(一)数学试题
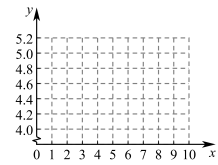
5 . 某机构为了研究中学生的视力与体育活动的关系,随机调查了几名中学生,得到了他们每周体育活动的时间(单位: )和视力的一组数据:
(Ⅰ)根据以上数据,在下面的坐标系中画出散点图;
(Ⅱ)用最小二乘法求与之间的线性回归方程.
参考公式:,.
)和视力的一组数据:每周体育活动时间 | 2 | 4 | 6 | 8 | 10 |
视力 | 4.0 | 4.2 | 4.6 | 5.0 | 5.2 |
(Ⅰ)根据以上数据,在下面的坐标系中画出散点图;
(Ⅱ)用最小二乘法求
与之间的线性回归方程.参考公式:
,.
您最近一年使用:0次
2020-07-15更新
|
166次组卷
|
3卷引用:河北省沧州市2020-2021学年高二上学期期末数学试题
解题方法
6 . 为测试特斯拉汽车的百米加速时间,研发人员记录了汽车在 取
取 、
、 、
、 、
、 、
、 、
、 、
、 时刻的位移,并对数据做了初步处理,得到图
 .同时,令
.同时,令 ,得到数据图
 ,现画出
,现画出 与,与
与,与 的散点图.
的散点图.
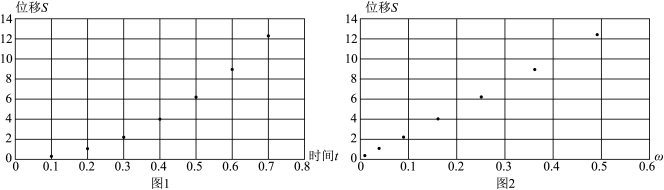
(1)根据散点图判断,与,与哪两个量之间线性相关程度更强?(直接给出判断即可);
(2)根据(1)的结果选择线性相关程度更强的两个量,建立相应的回归直线方程;
(3)根据(2)的结果预计特斯拉汽车百米加速需要的时间.
附:对于一组数据 、
、 、
、 、,其回归直线
 的斜率和截距的最小二乘估计分别为:
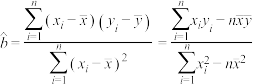 ,.
,.
取、、、、、、时刻的位移,并对数据做了初步处理,得到图.同时,令,得到数据图,现画出与,与的散点图.
|
|
|
|
|
|
|
| |||
|
|
|
|
|
|
|
|
|
| |
|
|
|
|
|
|
|
|
|
| |
|
|
|
|
|
|
|
|
|
| |
|
|
|
|
|
|
|
|
|
| |
|
|
|
|
|
|
|
|
|
| |
|
|
|
|
|
|
|
|
|
| |
|
|
|
|
|
|
|
|
|
| |
累加 |
|
|
|
| 累加 |
|
|
|
|


(1)根据散点图判断,
与,与哪两个量之间线性相关程度更强?(直接给出判断即可);(2)根据(1)的结果选择线性相关程度更强的两个量,建立相应的回归直线方程;
(3)根据(2)的结果预计特斯拉汽车百米加速需要的时间.
附:对于一组数据
、、、,其回归直线的斜率和截距的最小二乘估计分别为:,.
您最近一年使用:0次
名校
解题方法
7 . 某同学暑期做社会实践活动.对气温与某饮料的销量之间的关系进行调研,记录连续5天的数据如下:
(1)在给定的坐标系中画出表中数据的散点图;

(2)求出关于的线性回归方程,试预测气温是15度时大约可销售多少杯(取整数)?
(注: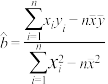 ,
, )
)
气温x( ) ) | 9 | 10 | 12 | 11 | 8 |
| 销量y(杯) | 22 | 25 | 29 | 26 | 20 |
(2)求出
关于的线性回归方程,试预测气温是15度时大约可销售多少杯(取整数)?(注:
,)
您最近一年使用:0次
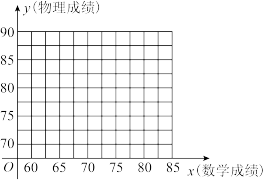
8 . 抽样得到某次考试中高二年级某班 名学生的数学成绩和物理成绩如下表:
(1)在图中画出表中数据的散点图;
(2)建立关于的回归方程:(系数保留到小数点后两位).
(3)如果某学生的数学成绩为 分,预测他本次的物理成绩(成绩取整数).
参考公式:回归方程为,其中 ,
, .
.
参考数据: ,
, ,
, .
.
名学生的数学成绩和物理成绩如下表:| 学生编号 | | |  |  |  | |
| 数学成绩 |  |  |  |  |  |  |
| 物里成绩 |  |  | |  |  |  |
(2)建立
关于的回归方程:(系数保留到小数点后两位).(3)如果某学生的数学成绩为
分,预测他本次的物理成绩(成绩取整数).参考公式:回归方程为
,其中,.参考数据:
,,.
您最近一年使用:0次
名校
9 . 某种产品的广告费用支出x(万元)与销售额y(万元)之间有如下的对应数据:
(1)画出散点图;
(2)求回归直线方程;
(3)据此估计广告费用为9万元时,销售收入y的值.
注:①参考公式:线性回归方程系数公式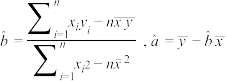 ;
;
②参考数据: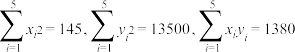
x | 2 | 4 | 5 | 6 | 8 |
y | 30 | 40 | 60 | 50 | 70 |
(2)求回归直线方程;
(3)据此估计广告费用为9万元时,销售收入y的值.
注:①参考公式:线性回归方程系数公式
;②参考数据:
您最近一年使用:0次
名校
10 . 一台还可以用的机器由于使用的时间较长,它按不同的转速生产出来的某机械零件有一些会有缺陷,每小时生产有缺陷零件的多少随机器运转的速率而变化,下表为抽样试验结果:
(1)画出散点图;
(2)如果y与x有线性相关的关系,求回归直线方程;
(3)若实际生产中,允许每小时生产的产品中有缺陷的零件最多为10个,那么机器的运转速度应控制在什么范围内?
| 转速x(转/秒) | 16 | 14 | 12 | 8 |
| 每小时生产有缺陷的零件数y(件) | 11 | 9 | 8 | 5 |
(2)如果y与x有线性相关的关系,求回归直线方程;
(3)若实际生产中,允许每小时生产的产品中有缺陷的零件最多为10个,那么机器的运转速度应控制在什么范围内?
您最近一年使用:0次
2018-10-02更新
|
1902次组卷
|
9卷引用:河北省南宫市第一中学2019-2020学年高二下学期3月月考数学试题
河北省南宫市第一中学2019-2020学年高二下学期3月月考数学试题河南省林州市第一中学2018-2019学年高二上学期开学考试数学试题2018-2019学年北师大版高中数学选修2-3同步配套(课件+练习):第三章检测广西北海市2018-2019学年高一下学期期中数学试题吉林省汪清县汪清第四中学2020-2021学年高二下学期第一次阶段考试数学(文)试题安徽省安庆市九一六学校2020-2021学年高二下学期开学考试数学(理)试题人教A版(2019) 选修第三册 过关斩将 第八章 8.2.1一元线性回归模型+8.2.2一元线性回归模型参数的最小二乘估计人教A版(2019) 选修第三册 核心素养 第八章 8.2 一元线性回归模型及其应用(已下线)8.2 一元线性回归模型及其应用(精讲)(1)


