名校
解题方法
1 . 2024年2月10日至17日(正月初一至初八),“2024•内江市中区新春极光焰火草地狂欢节”在川南大草原举行,共举行了8场精彩的烟花秀节目.前5场的观众人数(单位:万人)与场次的统计数据如表所示:
(1)已知可用线性回归模型拟合 与
与 的关系,请建立关于的线性回归方程;
(2)若该烟花秀节目分A、B、C三个等次的票价,某机构随机调查了该烟花秀节目现场200位观众的性别与购票情况,得到的部分数据如表所示,请将 列联表补充完整,并判断能否有
 的把握认为该烟花秀节目的观众是否购买A等票与性别有关.
参考公式及参考数据:回归方程 中斜率与截距的最小二乘法估计公式分别为
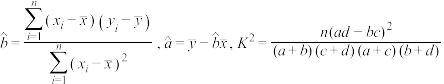 ,其中
,其中 .
.
场次编号 | 1 | 2 | 3 | 4 | 5 |
观众人数 | 0.7 | 0.8 | 1 | 1.2 | 1.3 |
与的关系,请建立关于的线性回归方程;(2)若该烟花秀节目分A、B、C三个等次的票价,某机构随机调查了该烟花秀节目现场200位观众的性别与购票情况,得到的部分数据如表所示,请将
列联表补充完整,并判断能否有的把握认为该烟花秀节目的观众是否购买A等票与性别有关.购买A等票 | 购买非A等票 | 总计 | |
男性观众 | 50 | ||
女性观众 | 60 | ||
总计 | 100 | 200 |
中斜率与截距的最小二乘法估计公式分别为,其中.
| 0.100 | 0.050 | 0.010 |
| 2.706 | 3.841 | 6.635 |


您最近一年使用:0次
昨日更新
|
829次组卷
|
2卷引用:四川省内江市2024届高三第三次模拟考试数学理科试题
名校
解题方法
2 . 某公司为提升 款产品的核心竞争力,准备加大款产品的研发投资,为确定投入款产品的年研发费用,需了解年研发费用(单位:万元)对年利润(单位:万元)的影响.该公司统计了最近8年每年投入款产品的年研发费用与年利润的数据,得到下图所示的散点图:与正线性相关,且相关程度较高.经计算得,
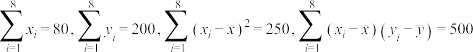 .
.
(1)建立关于的经验回归方程;
(2)若该公司对款产品欲投入的年研发费用为30万元,根据(1)得到的经验回归方程,预测年利润为多少万元?
附: .
.
款产品的核心竞争力,准备加大款产品的研发投资,为确定投入款产品的年研发费用,需了解年研发费用(单位:万元)对年利润(单位:万元)的影响.该公司统计了最近8年每年投入款产品的年研发费用与年利润的数据,得到下图所示的散点图: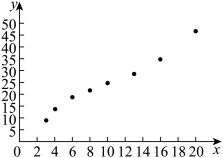
与正线性相关,且相关程度较高.经计算得,.(1)建立
关于的经验回归方程;(2)若该公司对
款产品欲投入的年研发费用为30万元,根据(1)得到的经验回归方程,预测年利润为多少万元?附:
.
您最近一年使用:0次
名校
解题方法
3 . 如图是我国2015年至2023年 岁及以上老人人口数(单位:亿)的折线图,
 分别对应年份
 .
.
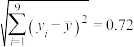
(1)由折线图看出,可用线性回归模型拟合与 的关系,请用相关系数(结果精确到
 )加以说明;
(2)建立关于的回归方程(系数精确到),并预测2024年我国岁及以上老人人口数(单位:亿).
参考数据: ,
, ,
, ,
, .
.
参考公式:相关系数 ,若
,若 ,则与有较强的线性相关性.
回归方程 中斜率和截距的最小二乘估计公式分别为:
 ,
, .
.
岁及以上老人人口数(单位:亿)的折线图,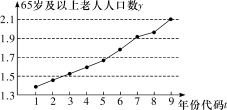
分别对应年份.(1)由折线图看出,可用线性回归模型拟合
与的关系,请用相关系数(结果精确到)加以说明;(2)建立
关于的回归方程(系数精确到),并预测2024年我国岁及以上老人人口数(单位:亿).参考数据:
,,,.参考公式:相关系数
,若,则与有较强的线性相关性.回归方程
中斜率和截距的最小二乘估计公式分别为:,.
您最近一年使用:0次
解题方法
4 . 市场调查员小王统计了某款拖把的销售单价(单位:元)与月销量(单位:个)之间的一组数据如下表所示:
(1)根据以往经验,与具有线性相关关系,求关于的线性回归方程;
(2)若这款拖把的进货价为14元/个,根据(1)中回归方程,求该拖把月利润最大时拖把的单价为多少元.(结果精确到0.1元)
附:回归直线方程 中,
中, .
.
(单位:元)与月销量(单位:个)之间的一组数据如下表所示:单价 元 元 | 18 | 19 | 20 | 21 | 22 |
月销量 个 个 | 570 | 520 | 420 | 320 | 270 |
与具有线性相关关系,求关于的线性回归方程;(2)若这款拖把的进货价为14元/个,根据(1)中回归方程,求该拖把月利润最大时拖把的单价为多少元.(结果精确到0.1元)
附:回归直线方程
中,.
您最近一年使用:0次
5 . 某公司为了了解某商品的月销售量 单位:万件
单位:万件 与月销售单价
 单位:元
单位:元 件之间的关系,随机统计了
 个月的销售量与销售单价,并制作了如下对照表:
由表中数据可得回归方程 中
中 ,试预测当月销售单价为
 元件时,月销售量为
______ 万件.
单位:万件与月销售单价单位:元件之间的关系,随机统计了个月的销售量与销售单价,并制作了如下对照表: | 月销售单价元件 |  |  |  |  |  |
| 月销售量万件 |  | |  |  | |
中,试预测当月销售单价为元件时,月销售量为
您最近一年使用:0次
2024·全国·模拟预测
6 . 某市一水果店为了了解柑橘的月销售量(单位:千克)与月平均气温(单位: )之间的关系,随机统计了4个月的柑橘的月销售量与当月的平均气温,其数据如下表:
由表中数据得到关于的线性回归方程为 ,气象部门预测2024年4月该市的平均气温为
 ,据此估计该水果店2024年4月柑橘的销售量为
______ 千克.
(单位:千克)与月平均气温(单位:)之间的关系,随机统计了4个月的柑橘的月销售量与当月的平均气温,其数据如下表:| 月平均气温x/ | 18 | 12 | 8 | 2 |
| 月销售量千克 | 26 | 45 | 62 | 77 |
关于的线性回归方程为,气象部门预测2024年4月该市的平均气温为,据此估计该水果店2024年4月柑橘的销售量为
您最近一年使用:0次
2024·全国·模拟预测
解题方法
7 . 近年来,随着人们对健康饮食的重视和市场对禽肉需求的增长,养鸡业发展迅速,我国养鸡企业发展也取得了显著成就.某小型养鸡场从2017年到2023年每年养鸡数量(单位:千只)的统计结果如下表所示.
(1)由统计表看出,可用线性回归模型拟合与的关系,请用相关系数加以说明(系数精确到0.01);
(2)建立关于的回归方程(系数精确到0.01),并预测该小型养鸡场2026年养鸡的数量.
参考数据: .
.
参考公式:相关系数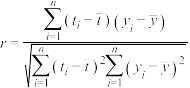 ,回归方程中斜率和截距的最小二乘估计公式分别为
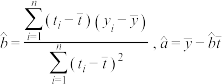 .
.
(单位:千只)的统计结果如下表所示.| 年份 | 2017 | 2018 | 2019 | 2020 | 2021 | 2022 | 2023 |
| 年份代码 | 1 | 2 | 3 | 4 | 5 | 6 | 7 |
| 养鸡数量千只 | 2 | 3 | 7 | 5 | 8 | 11 | 13 |
与的关系,请用相关系数加以说明(系数精确到0.01);(2)建立
关于的回归方程(系数精确到0.01),并预测该小型养鸡场2026年养鸡的数量.参考数据:
.参考公式:相关系数
,回归方程中斜率和截距的最小二乘估计公式分别为.
您最近一年使用:0次
名校
解题方法
8 . 某企业近年来的广告费用(百万元)与所获得的利润(千万元)的数据如下表所示,已知与之间具有线性相关关系.
(1)求关于的线性回归方程;
(2)若该企业从2018年开始,广告费用连续每一年都比上一年增加10万元,根据(1)中所得的线性回归方程,预测2025年该企业可获得的利润.
参考公式: .
.
(百万元)与所获得的利润(千万元)的数据如下表所示,已知与之间具有线性相关关系.年份 | 2018 | 2019 | 2020 | 2021 | 2022 |
广告费用 | 1.5 | 1.6 | 1.7 | 1.8 | 1.9 |
润 | 1.6 | 2 | 2.4 | 2.5 | 3 |
关于的线性回归方程;(2)若该企业从2018年开始,广告费用连续每一年都比上一年增加10万元,根据(1)中所得的线性回归方程,预测2025年该企业可获得的利润.
参考公式:
.
您最近一年使用:0次
2024-04-23更新
|
691次组卷
|
2卷引用:陕西省西安市部分学校2024届高三下学期高考模拟检测文科数学试卷
解题方法
9 . 近些年来,促进新能源汽车产业发展政策频出,新能源市场得到很大发展,销量及渗透率远超预期,新能源几乎成了各个汽车领域的热点.某车企通过市场调研并进行粗略模拟,得到研发投入(亿元)与经济收益(亿元)的数据,统计如下:
(1)计算 的相关系数
的相关系数 ,并判断是否可以认为研发投入与经济收益具有较高的线性相关程度:(若
 ,则线性相关程度一般,若
 ,则线性相关程度较高)
(2)求出关于的线性回归方程,并预测研发投入10亿元时的经济收益.
参考数据: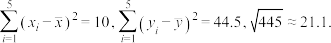
附:相关系数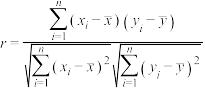 ,线性回归方程的斜率
 ,截距
,截距 .
.
(亿元)与经济收益(亿元)的数据,统计如下:| 研发投入亿元 | 1 | 2 | 3 | 4 | 5 |
| 经济收益亿元 | 2.5 | 4 | 6.5 | 9 | 10.5 |
(1)计算
的相关系数,并判断是否可以认为研发投入与经济收益具有较高的线性相关程度:(若,则线性相关程度一般,若,则线性相关程度较高)(2)求出
关于的线性回归方程,并预测研发投入10亿元时的经济收益.参考数据:
附:相关系数
,线性回归方程的斜率,截距.
您最近一年使用:0次
2024·全国·模拟预测
10 . 20世纪80年代初,随着我国的改革开放,经济体制和经营体制逐渐灵活,市场上的商品日益丰富,城市和农村出现小卖部.小卖部主营生活日用商品,有着经营成本小、规模小、商品种类少分布广等特点.近几年,人们的生活水平达到了新的高度,实体小卖部逐渐被应运而生的大小超市所取代.为适应市场,某小卖部经营者欲将经营规模扩大,将小卖部发展成生鲜综合超市,现将2013~2022年的年利润(单位:万元)统计如下:
其中,年限1表示2013年,2表示2014年,3表示2015年,……,以此类推,10表示2022年.
(1)若年利润(单位:万元)与小卖部营业年限成正相关关系,在不改变经营状态的情况下,预测该小卖部2023年的年利润;
(2)以年利润是否低于12万元为评价标准,按照分层抽样从2013~2022年的年利润中随机抽取5个,再从这5个数据中随机抽取2个,求抽取的2个数据至少有1个低于12万元的概率.
附:线性回归方程 中,
中, ,其中
,其中 为样本均值.
年限 | 1 | 2 | 3 | 4 | 5 | 6 | 7 | 8 | 9 | 10 |
年利润(万元) | 2 | 8 | 9 | 12 | 10 | 13 | 15 | 16 | 17 | 18 |
(1)若年利润
(单位:万元)与小卖部营业年限成正相关关系,在不改变经营状态的情况下,预测该小卖部2023年的年利润;(2)以年利润是否低于12万元为评价标准,按照分层抽样从2013~2022年的年利润中随机抽取5个,再从这5个数据中随机抽取2个,求抽取的2个数据至少有1个低于12万元的概率.
附:线性回归方程
中,,其中为样本均值.
您最近一年使用:0次


