名校
解题方法
1 . 下列说法正确的是( )
A.若随机变量X,Y满足 ,则 ,则 |
B.相关指数 越大,残差平方和越小,回归模型拟合效果越好 越大,残差平方和越小,回归模型拟合效果越好 |
C.已知 ,且事件 ,且事件 与 与 不独立,则 不独立,则 |
D.已知随机变量 的均值为 的均值为 ,方差为 ,方差为 ,常数 ,常数 ,则 ,则 |
您最近一年使用:0次
解题方法
2 . 下列命题中正确是( )
A.线性相关系数 越大,两个变量的线性相关性越强 越大,两个变量的线性相关性越强 |
B.在经验回归方程 中,当解释变量每增加1个单位时,响应变量将平均增加0.5个单位 中,当解释变量每增加1个单位时,响应变量将平均增加0.5个单位 |
C.若随机变量的期望 ,则 ,则 |
D.若 ,且 ,且 ,则 ,则 |
您最近一年使用:0次
3 . 为了解某一地区新能源电动汽车销售情况,一机构根据统计数据,用最小二乘法得到电动汽车销量 (单位:万台)关于
 (年份)的线性回归方程
 ,且销量的方差为
 ,年份的方差为
 .
.
(1)求与的相关系数,并据此判断电动汽车销量与年份的线性相关性的强弱.
(2)该机构还调查了该地区90位购车车主的性别与购车种类情况,得到的数据如下表:
依据小概率值 的独立性检验,能否认为购买电动汽车与车主性别有关?
(3)在购买电动汽车的车主中按照性别进行分层抽样抽取7人,再从这7人中随机抽取3人,记这3人中男性的人数为,求的分布列和数学期望.
①参考数据: .
.
②参考公式:线性回归方程为 ,其中
,其中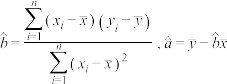 ;
;
相关系数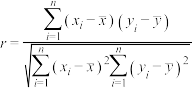 ,若
,若 ,则可判断与线性相关较强;
 ,其中
,其中 .附表:
.附表:
(单位:万台)关于(年份)的线性回归方程,且销量的方差为,年份的方差为.(1)求
与的相关系数,并据此判断电动汽车销量与年份的线性相关性的强弱.(2)该机构还调查了该地区90位购车车主的性别与购车种类情况,得到的数据如下表:
性别 | 购买非电动汽车 | 购买电动汽车 | 总计 |
男性 | 39 | 6 | 45 |
女性 | 30 | 15 | 45 |
总计 | 69 | 21 | 90 |
的独立性检验,能否认为购买电动汽车与车主性别有关?(3)在购买电动汽车的车主中按照性别进行分层抽样抽取7人,再从这7人中随机抽取3人,记这3人中男性的人数为
,求的分布列和数学期望.①参考数据:
.②参考公式:线性回归方程为
,其中;相关系数
,若,则可判断与线性相关较强;,其中.附表:
| 0.10 | 0.05 | 0.010 | 0.001 |
| 2.706 | 3.841 | 6.635 | 10.828 |

您最近一年使用:0次
名校
4 . 某新能源汽车公司对其产品研发投资额x(单位:百万元)与其月销售量y(单位:千辆)的数据进行统计,得到如下统计表和散点图.
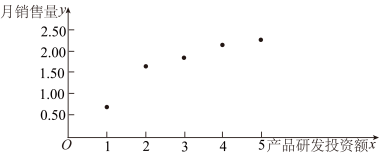
(1)通过分析散点图的特征后,计划用 作为月销售量y关于产品研发投资额x的回归分析模型,根据统计表和参考数据,求出y关于x的回归方程;
(2)公司决策层预测当投资额为11百万元时,决定停止产品研发,转为投资产品促销.根据以往的经验,当投资11百万元进行产品促销后,月销售量 的分布列为:
结合回归方程和的分布列,试问公司的决策是否合理.
参考公式及参考数据: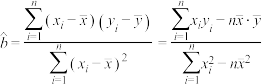 ,
, ,
, .
.
| x | 1 | 2 | 3 | 4 | 5 |
| y | 0.69 | 1.61 | 1.79 | 2.08 | 2.20 |
(1)通过分析散点图的特征后,计划用
作为月销售量y关于产品研发投资额x的回归分析模型,根据统计表和参考数据,求出y关于x的回归方程;(2)公司决策层预测当投资额为11百万元时,决定停止产品研发,转为投资产品促销.根据以往的经验,当投资11百万元进行产品促销后,月销售量
的分布列为: | 3 | 4 | 5 |
| P |  | p |  |
的分布列,试问公司的决策是否合理.参考公式及参考数据:
,,.y | 0.69 | 1.61 | 1.79 | 2.08 | 2.20 |
| 2 | 5 | 6 | 8 | 9 |
 (保留整数)
您最近一年使用:0次
2023-05-09更新
|
1210次组卷
|
3卷引用:贵州省毕节市2023届高三诊断性考试(三)数学(理)试题
解题方法
5 . 为了研究某种细菌随天数x变化的繁殖个数y,收集数据如下:
天数x | 1 | 2 | 3 | 4 | 5 | 6 |
繁殖个数y | 6 | 12 | 25 | 49 | 95 | 190 |
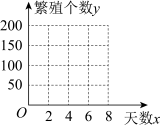
(1)在图中作出繁殖个数y关于天数x变化的散点图,并由散点图判断
 (a,b为常数)与
 (
( ,
, 为常数,且
为常数,且 ,
, )哪一个适宜作为繁殖个数y关于天数x变化的回归方程类型?(给出判断即可,不必说明理由)
(2)对于非线性回归方程
(,为常数,且,),令 ,可以得到繁殖个数的对数z关于天数x具有线性关系及一些统计量的值.
|
|
|
|
|
|
3.50 | 62.83 | 3.53 | 17.50 | 596.57 | 12.09 |


①证明:“对于,令,可以得到繁殖个数的对数z关于天数x具有 ,β,α为常数)”;
②根据(1)的判断结果及表中数据,建立y关于x的回归方程(系数保留2位小数).
附:对于一组数据 ,
, ,…,
,…, ,其回归直线方程
 的斜率和截距的最小二乘估计分别为
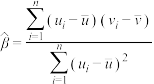 ,
, .
.
您最近一年使用:0次
2023-03-21更新
|
1184次组卷
|
12卷引用:贵州省贵阳市五校2023届高三上学期联合考试(三)数学(文)试题
贵州省贵阳市五校2023届高三上学期联合考试(三)数学(文)试题贵州省贵阳市五校2023届高三上学期联合考试(三)数学(理)试题(已下线)2022-2023学年高三新高考数学押题卷(四)(已下线)2023年高三数学(理)押题卷一(已下线)第04讲 第九章 统计与成对数据的统计分析(基础拿分卷)(已下线)专题11-1 直方图、回归方程(线性与非线性)-1(已下线)新高考卷05(已下线)9.1.2线性回归方程(1)(已下线)成对数据的统计分析章末测试卷(二)-【帮课堂】2022-2023学年高二数学同步精品讲义(人教A版2019选择性必修第三册)(已下线)8.2 一元线性回归模型及其应用(题型专训)-2022-2023学年高二数学同步精品课堂(人教A版2019选择性必修第三册)(已下线)第八章 成对数据的统计分析(知识归纳+题型突破)-2023-2024学年高二数学单元速记·巧练(人教A版2019选择性必修第三册)(已下线)第04讲 拓展一:数学建模 建立统计模型进行预测(非线性回归模型)-【帮课堂】2023-2024学年高二数学同步学与练(人教A版2019选择性必修第三册)
名校
6 . 已知某种商品的价格(单位:元)和需求量(单位:件)之间存在线性关系,下表是试营业期间记录的数据( 对应的需求量因污损缺失):
经计算得 ,
, ,
, ,由前
,由前 组数据计算出的关于的线性回归方程为
 .
.
(1)估计对应的需求量y(结果保留整数);
(2)若对应的需求量恰为(1)中的估计值,求 组数据的相关系数(结果保留三位小数).
附:相关系数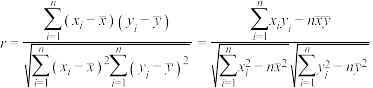 ,
, .
.
对应的需求量因污损缺失):| 价格 |  |  |  |  |  |  |
| 需求量 |  |  |  |  |  |  |
,,,由前组数据计算出的关于的线性回归方程为.(1)估计
对应的需求量y(结果保留整数);(2)若
对应的需求量恰为(1)中的估计值,求组数据的相关系数(结果保留三位小数).附:相关系数
,.
您最近一年使用:0次
2023-03-20更新
|
474次组卷
|
4卷引用:贵州省铜仁市2023届高三适应性考试(二)数学(文)试题
名校
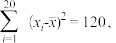
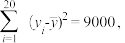
7 . “十四五”规划纲要提出,全面推动长江经济带发展,协同推动生态环境保护和经济发展长江水资源约占全国总量的36%,长江流域河湖、水库、湿地面积约占全国的20%,珍稀濒危植物占全国的39.7%,淡水鱼类占全国的33%.长江经济带在我国生态文明建设中占据重要位置.长江流域某地区经过治理,生态系统得到很大改善,水生动物数量有所增加.为调查该地区某种水生动物的数量,将其分成面积相近的100个水域,从这些水域中用简单随机抽样的方法抽取20个作为样区,调查得到样本数据 其中
其中 和
和 分别表示第i个样区的水草覆盖面积(单位:公顷)和这种水生动物的数量,并计算得
 ,
,

(1)求该地区这种水生动物数量的估计值(这种水生动物数量的估计值等于样区这种水生动物数量的平均数乘以地块数);
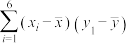
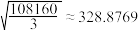
(2)求样本 的相关系数(精确到0.01);
(3)根据现有统计资料,各地块间水草覆盖面积差异很大.为提高样本的代表性以获得该地区这种水生动物数量更准确的估计,请给出一种你认为更合理的抽样方法,并说明理由.
附:相关系数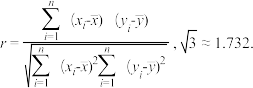
其中和分别表示第i个样区的水草覆盖面积(单位:公顷)和这种水生动物的数量,并计算得,(1)求该地区这种水生动物数量的估计值(这种水生动物数量的估计值等于样区这种水生动物数量的平均数乘以地块数);
(2)求样本
的相关系数(精确到0.01);(3)根据现有统计资料,各地块间水草覆盖面积差异很大.为提高样本的代表性以获得该地区这种水生动物数量更准确的估计,请给出一种你认为更合理的抽样方法,并说明理由.
附:相关系数
您最近一年使用:0次
2022-06-07更新
|
1191次组卷
|
5卷引用:贵阳第一中学2022届5月高三高考适应性月考卷(八)数学(文)试题
解题方法
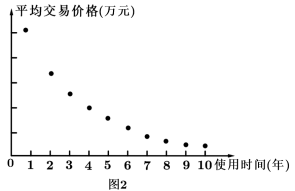
8 . 某二手车交易市场对2020年某品牌二手车的交易进行了统计,得到如图所示的频率分布直方图和散点图.用表示该车的使用时间(单位:年),表示其相应的平均交易价格(单位:万元).
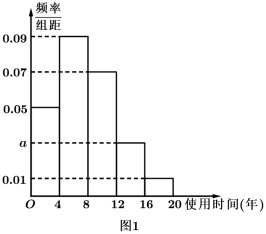
(Ⅰ)已知2020年在此交易市场成交的该品牌二手车为 辆,求使用时间在
 的车辆数;
的车辆数;
(Ⅱ)由散点图分析后,可用 作为此交易市场上该种车辆的平均交易价格关于其使用时间的回归方程.
表中, .根据上述相关数据,求关于的回归方程.
附:对于一组数据,,…,,其回归直线 的斜率和截距的最小二乘估计分别为:
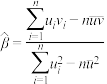 ,
, .
.
表示该车的使用时间(单位:年),表示其相应的平均交易价格(单位:万元).(Ⅰ)已知2020年在此交易市场成交的该品牌二手车为
辆,求使用时间在的车辆数;(Ⅱ)由散点图分析后,可用
作为此交易市场上该种车辆的平均交易价格关于其使用时间的回归方程.
|
|
|
|
|
|
5.5 | 9 | 2 | 300 | 80 | 385 |


 ,.根据上述相关数据,求关于的回归方程.
附:对于一组数据
,,…,,其回归直线的斜率和截距的最小二乘估计分别为:,.
您最近一年使用:0次
解题方法
9 . 某高速公路服务区从2020年中的前10个月份中随机抽取6个月份,并统计销售收入(单位:万元)的数据,得到如下统计表:
整理相关数据得到: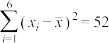 ,
, ,
, ,
,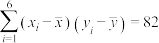 ,
, .
.
(1)求样本 (
( )的相关系数,根据求出的相关系数,试说明样本数据具有较强的线性相关关系;
(2)建立关于的线性回归方程;( 的结果;小数点后四舍五入保留两位数字)
(3)根据(2)中求得的关于的线性回归方程,试估计该高速公路服务区12月份的销售收入(保留整数).
附:相关系数 ;
;
回归方程 中斜率和截距的最小二乘估计公式分别为:
 ;
; .
.
,并统计销售收入(单位:万元)的数据,得到如下统计表:月份 | 1 | 2 | 4 | 6 | 8 | 9 |
销售收入 | 44 | 45 | 48 | 52 | 55 | 56 |
,,,,.(1)求样本
()的相关系数,根据求出的相关系数,试说明样本数据具有较强的线性相关关系;(2)建立
关于的线性回归方程;(的结果;小数点后四舍五入保留两位数字)(3)根据(2)中求得的
关于的线性回归方程,试估计该高速公路服务区12月份的销售收入(保留整数).附:相关系数
;回归方程
中斜率和截距的最小二乘估计公式分别为:;.
您最近一年使用:0次
名校
解题方法
10 .  指数是用体重公斤数除以身高米数的平方得出的数字,是国际上常用的衡量人体胖瘦程度以及是否健康的一个标准.对于高中男体育特长生而言,当数值大于或等于20.5时,我们说体重较重,当数值小于20.5时,我们说体重较轻,身高大于或等于
 我们说身高较高,身高小于170cm我们说身高较矮.
(Ⅰ)已知某高中共有32名男体育特长生,其身高与 指数的数据如散点图,请根据所得信息,完成下述列联表,并判断是否有
 的把握认为男生的身高对指数有影响.
(Ⅱ)①从上述32名男体育特长生中随机选取8名,其身高和体重的数据如表所示:
根据最小二乘法的思想与公式求得线性回归方程为 .利用已经求得的线性回归方程,请完善下列残差表,并求(解释变量(身高)对于预报变量(体重)变化的贡献值)(保留两位有效数字);
②通过残差分析,对于残差的最大(绝对值)的那组数据,需要确认在样本点的采集中是否有人为的错误,已知通过重新采集发现,该组数据的体重应该为 .小明重新根据最小二乘法的思想与公式,已算出
 ,请在小明所算的基础上求出男体育特长生的身高与体重的线性回归方程.
参考数据:
 ,
, ,
, ,
, ,
,
参考公式: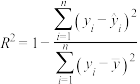 ,,,
,,, ,
, .
.
指数是用体重公斤数除以身高米数的平方得出的数字,是国际上常用的衡量人体胖瘦程度以及是否健康的一个标准.对于高中男体育特长生而言,当数值大于或等于20.5时,我们说体重较重,当数值小于20.5时,我们说体重较轻,身高大于或等于我们说身高较高,身高小于170cm我们说身高较矮.(Ⅰ)已知某高中共有32名男体育特长生,其身高与
指数的数据如散点图,请根据所得信息,完成下述列联表,并判断是否有的把握认为男生的身高对指数有影响.| 身高较矮 | 身高较高 | 合计 | |
| 体重较轻 | |||
| 体重较重 | |||
| 合计 |
(Ⅱ)①从上述32名男体育特长生中随机选取8名,其身高和体重的数据如表所示:
| 编号 | 1 | 2 | 3 | 4 | 5 | 6 | 7 | 8 |
身高 | 166 | 167 | 160 | 173 | 178 | 169 | 158 | 173 |
体重 | 57 | 58 | 53 | 61 | 66 | 57 | 50 | 66 |
根据最小二乘法的思想与公式求得线性回归方程为
.利用已经求得的线性回归方程,请完善下列残差表,并求(解释变量(身高)对于预报变量(体重)变化的贡献值)(保留两位有效数字);| 编号 | 1 | 2 | 3 | 4 | 5 | 6 | 7 | 8 |
| 体重(kg) | 57 | 58 | 53 | 61 | 66 | 57 | 50 | 66 |
残差 |  |  |  |  |  |  | |
②通过残差分析,对于残差的最大(绝对值)的那组数据,需要确认在样本点的采集中是否有人为的错误,已知通过重新采集发现,该组数据的体重应该为
.小明重新根据最小二乘法的思想与公式,已算出,请在小明所算的基础上求出男体育特长生的身高与体重的线性回归方程.参考数据:
,,,,参考公式:
,,,,. | 0.10 | 0.05 | 0.01 | 0.005 |
 | 2.706 | 3.811 | 6.635 | 7.879 |
您最近一年使用:0次
2020-06-23更新
|
896次组卷
|
3卷引用:贵州省遵义市南白中学2020届高三第六次联考数学(文)试题


