2023·全国·模拟预测
1 . 2015—2019年,中国社会消费品零售额占GDP的比重超过4种,2020年后,中国社会消费品零售额占GDP的比重逐年下降.下表为2018—2022年中国社会消费品零售额(单位:万亿元)及其占GDP的比重y(单位:%)的数据,其中2018—2022年对应的年份代码x依次为1~5.
年份代码x | 1 | 2 | 3 | 4 | 5 |
社会消费品零售额 | 37.8 | 40.8 | 39.2 | 44.1 | 44.0 |
社会消费品零售额占 GDP的比重y/% | 41.3 | 41.5 | 39.0 | 38.6 | 36.7 |
(1)由上表数据,是否可用一元线性回归模型拟合y与x的关系,请用相关系数加以说明.
(2)请建立y关于x的一元线性回归方程.
(3)从2018—2022年中国社会消费品零售额这5个数据中随机抽取2个数据.若抽取的2个数据中至少有1个数据大于40.0,求这2个数据恰好有1个数据不小于44.0的概率.
附: ,
, ,
, ,
, ,
,
相关系数 .
.
对于一组数据 ,其一元线性回归直线
 的斜率和截距的最小二乘估计公式分别为
 ,
, .
.
您最近一年使用:0次
2023-11-20更新
|
923次组卷
|
5卷引用:2024年普通高等学校招生全国统一考试·信息卷理科数学(三)
(已下线)2024年普通高等学校招生全国统一考试·信息卷理科数学(三)(已下线)第十章 重难专攻(十三) 概率与统计的综合问题(讲)(已下线)高考2024年普通高等学校招生全国统一考试?信息卷数学(六)(已下线)第二篇 “搞定”解答题前3个 专题3 概率统计解答题【练】 高三逆袭之路突破90分(已下线)第02讲 8.2 一元线性回归模型及其应用(知识清单+6类热点题型精讲+强化分层精练)-【帮课堂】2023-2024学年高二数学同步学与练(人教A版2019选择性必修第三册)
2023·全国·模拟预测
解题方法
2 . 连续抛掷一枚质地均匀的骰子3次,观察向上的点数.在第1次出现奇数的条件下,3次出现的点数之积为偶数的概率为( )
A. | B. | C. | D. |
您最近一年使用:0次
2023-11-20更新
|
921次组卷
|
5卷引用:2024年普通高等学校招生全国统一考试·信息卷理科数学(六)
(已下线)2024年普通高等学校招生全国统一考试·信息卷理科数学(六)(已下线)高考2024年普通高等学校招生全国统一考试?信息卷数学(三)(已下线)专题12 概率(3大易错点分析+解题模板+举一反三+易错题通关)(已下线)专题7.1 条件概率与全概率公式【五大题型】-2023-2024学年高二数学举一反三系列(人教A版2019选择性必修第三册)(已下线)第7.1.1讲 条件概率-2023-2024学年新高二数学同步精讲精练宝典(人教A版2019选修第三册)
3 . 男运动员6名,女运动员4名,其中男、女队长各1名.现选派 5人外出参加比赛.
(1)队长中至少有1人参加,有多少种选派方法?
(2)参赛的运动员需要分坐在两辆车上(每辆车上至少有一名运动员),有多少种安排方式?
(1)队长中至少有1人参加,有多少种选派方法?
(2)参赛的运动员需要分坐在两辆车上(每辆车上至少有一名运动员),有多少种安排方式?
您最近一年使用:0次
2023-11-01更新
|
800次组卷
|
8卷引用:新疆乌鲁木齐市第六十八中学2022-2023学年高二下学期期中考试数学试题
新疆乌鲁木齐市第六十八中学2022-2023学年高二下学期期中考试数学试题江西省部分学校2023-2024学年高二上学期11月月考数学试题(已下线)第07讲 第六章 计数原理 章节验收测评卷-【帮课堂】2023-2024学年高二数学同步学与练(人教A版2019选择性必修第三册)(已下线)3.1.3 组合和组合数(第2课时 组合和组合数的应用)(分层练习)-2023-2024学年高二数学同步精品课堂(人教B版2019选择性必修第二册)(已下线)第六章 计数原理(知识归纳+题型突破)(2)(已下线)第6.2.2讲 组合与组合数-2023-2024学年新高二数学同步精讲精练宝典(人教A版2019选修第三册)(已下线)模块三 专题4 大题分类练(排列组合)(人教A)(已下线)模块三 专题2 解答题分类练 专题4 计数原理(二项式定理)(苏教版)
解题方法
4 . 若到2035年底我国人口数量增长至14.4亿,由2013年到2019年的统计数据可得国内生产总值( )
) (万亿元)关于年份代号
 的回归方程为
 ,则由回归方程预测我国在2035年底人均国内生产总值约为
______ 万元.(保留一位小数)
)(万亿元)关于年份代号的回归方程为,则由回归方程预测我国在2035年底人均国内生产总值约为
您最近一年使用:0次
2024-03-21更新
|
55次组卷
|
5卷引用:沪教版(2020) 选修第二册 单元训练 第8章 一元线性回归分析(B卷)
沪教版(2020) 选修第二册 单元训练 第8章 一元线性回归分析(B卷)(已下线)一元线性回归模型及其应用(已下线)第八章 成对数据的统计分析(知识归纳+题型突破)-2023-2024学年高二数学单元速记·巧练(沪教版2020选择性必修第二册)(已下线)8.2 一元线性回归模型及其应用(分层练习,7大题型)-2023-2024学年高二数学同步精品课堂(人教A版2019选择性必修第三册)(已下线)8.2 一元线性回归模型及其应用——课后作业(提升版)
解题方法
5 . 2023年8月31日贵南高铁实现全线贯通运营,我国西南和华南地区新增一条交通大动脉,黔桂两地间交通出行更加便捷、西南与华南地区联系将更加紧密.贵南高铁线路全长482公里,设计时速350公里,南宁东到贵阳东旅行时间由原来的5个多小时缩短至最快2小时53分.贵阳某调研机构调查了一个来自南宁的旅行团对贵阳两种特色小吃肠旺面和丝娃娃的喜爱情况,了解到其中有 的人喜欢吃肠旺面,有
 的人喜欢吃丝娃娃,还有
 的人既不喜欢吃肠旺面也不喜欢吃丝娃娃.在已知该旅行团一游客喜欢吃肠旺面的条件下,他还喜欢吃丝娃娃的概率为( )
的人喜欢吃肠旺面,有的人喜欢吃丝娃娃,还有的人既不喜欢吃肠旺面也不喜欢吃丝娃娃.在已知该旅行团一游客喜欢吃肠旺面的条件下,他还喜欢吃丝娃娃的概率为( )A. | B. | C. | D. |
您最近一年使用:0次
2023-10-10更新
|
373次组卷
|
4卷引用:贵州省贵阳市六校(贵州省实验中学等)2024届高三上学期联合考试(一)数学试题
贵州省贵阳市六校(贵州省实验中学等)2024届高三上学期联合考试(一)数学试题(已下线)6.1.1条件概率的概念(分层练习)-2023-2024学年高二数学同步精品课堂(北师大版2019选择性必修第一册)(已下线)4.1.1 条件概率(分层练习)-2023-2024学年高二数学同步精品课堂(人教B版2019选择性必修第二册)(已下线)第7.1.1讲 条件概率-2023-2024学年新高二数学同步精讲精练宝典(人教A版2019选修第三册)
解题方法
6 . 云南省统计局发布《全省旅游业发展情况(2015-2022年)》报告,其中2015年至2022年游客总人数y(单位:亿人次)的数据如下表:
为了预测2023年云南省游客总人数,根据2015年至2022年游客总人数y的数据建立线性回归模型一,得到回归方程 :
: ,但由于受到2020年疫情影响,估计预测不准确,若用2015年至2019年数据建立线性回归模型二,得到回归方程
 :
:
(1)根据和预测2023年云南省游客总人数(预测数据精确到0.1);
(2)为了检验两种模型的预测效果,对两种模型作残差分析得到:
模型一:总偏差平方和 ,残差平方和
 ;
;
模型二:总偏差平方和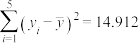 ,残差平方和
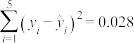 ,
,
用 来比较模型一与模型二的拟合效果(精确到0.001);
(3)根据2020年至2022年游客总人数y的数据建立线性回归模型三,求回归方程 ,并根据预测2023年云南省游客总人数(预测数据精确到0.1).
参考公式: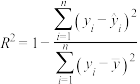 ,
, ,,.
,,.
年份 | 2015 | 2016 | 2017 | 2018 | 2019 | 2020 | 2021 | 2022 |
年份代号x | 1 | 2 | 3 | 4 | 5 | 6 | 7 | 8 |
游客总人数y | 3.3 | 4.3 | 5.7 | 6.9 | 8.1 | 5.3 | 6.5 | 8.4 |
:,但由于受到2020年疫情影响,估计预测不准确,若用2015年至2019年数据建立线性回归模型二,得到回归方程:(1)根据
和预测2023年云南省游客总人数(预测数据精确到0.1);(2)为了检验两种模型的预测效果,对两种模型作残差分析得到:
模型一:总偏差平方和
,残差平方和;模型二:总偏差平方和
,残差平方和,用
来比较模型一与模型二的拟合效果(精确到0.001);(3)根据2020年至2022年游客总人数y的数据建立线性回归模型三,求回归方程
,并根据预测2023年云南省游客总人数(预测数据精确到0.1).参考公式:
,,,.
您最近一年使用:0次
2023-10-07更新
|
347次组卷
|
5卷引用:云南省昆明市第二十四中学2024届高三上学期月考数学试题(一)
云南省昆明市第二十四中学2024届高三上学期月考数学试题(一)(已下线)第三节 成对数据的统计分析(第一课时)(核心考点集训)一轮复习点点通(已下线)第八章 成对数据的统计分析(单元重点综合测试)(19题新结构)-2023-2024学年高二数学单元速记·巧练(人教A版2019选择性必修第三册)(已下线)第02讲 8.2 一元线性回归模型及其应用(知识清单+6类热点题型精讲+强化分层精练)-【帮课堂】2023-2024学年高二数学同步学与练(人教A版2019选择性必修第三册)(已下线)8.2 一元线性回归模型及其应用——课后作业(巩固版)
7 . 若 ,且
,且 ,则( )
,则( )
,且,则( )| A.a的最小值为4 | B. 的最小值为4 的最小值为4 |
| C.a的最大值为4 | D.的最大值为4 |
您最近一年使用:0次
2023-10-07更新
|
489次组卷
|
6卷引用:河北省邢台市四校质检联盟2024届高三上学期第一次月考数学试题
河北省邢台市四校质检联盟2024届高三上学期第一次月考数学试题(已下线)第九章 综合测试A(基础卷)(已下线)6.4.1二项分布(分层练习)-2023-2024学年高二数学同步精品课堂(北师大版2019选择性必修第一册)(已下线)7.4.1 二项分布(导学案)-【上好课】高二数学同步备课系列(人教A版2019选择性必修第三册)(已下线)7.4.1 二项分布(分层练习,6大题型)-2023-2024学年高二数学同步精品课堂(人教A版2019选择性必修第三册)(已下线)7.4.1二项分布 第三练 能力提升拔高
解题方法
8 . 一场精彩的足球赛即将举行,5个球迷好不容易才买到一张入场券.大家都想去,只好用抽签的方法来决定,准备5张同样的卡片,其中一张卡片的正面写有“入场券”,其余的什么也不写.将它们背面朝上放在一起洗匀,让5个人依次不放回地抽取.问后抽比先抽的吃亏吗?
您最近一年使用:0次
解题方法
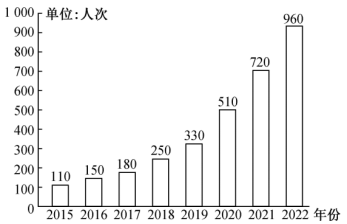
9 . 如图是M市某爱国主义教育基地宣传栏中标题为“2015~2022年基地接待青少年人次”的统计图.根据该统计图提供的信息解决下列问题.
①参考数据:
| 0 | 1 | 2 | 3 |
|
|
| 90 | 330 |


②参考公式:对于一组数据 ,其回归直线的斜率和截距的最小二乘法公式分别为:
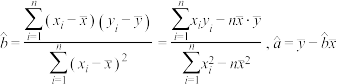 .
.
(1)求M市爱国主义教育基地所统计的8年中接待青少年人次的平均值和中位数;
(2)由统计图可看出,从2019年开始,M市爱国主义教育基地接待青少年的人次呈直线上升趋势,请你用线性回归分析的方法预测2024年基地接待青少年的人次.
您最近一年使用:0次
10 . 某湿地公园经过近十年的规划和治理,生态系统得到很大改善,野生动物数量有所增加.为调查该地区某种野生动物的数量,将其分成面积相近的300个地块,并在该地区应用分层抽样的方法抽取30个作为样本区,调查得到样本数据 ,其中
,其中 和
和 分别表示第
分别表示第 个样区的植物覆盖面积(单位:公顷)和这种野生动物的数量,并计算得
 ,
, ,
,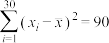 ,
,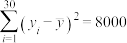 ,
, .
.
(1)求该地区这种野生动物数量的估计值(这种野生动物数量的估计值等于样区这种野生动物数量的平均数乘以地块数);
(2)求抽取的样本的相关系数(精确到0.01),并用相关系数说明各样区的这种野生动物的数量与植物覆盖面积的相关性.
附:相关系数 .
.
,其中和分别表示第个样区的植物覆盖面积(单位:公顷)和这种野生动物的数量,并计算得,,,,.(1)求该地区这种野生动物数量的估计值(这种野生动物数量的估计值等于样区这种野生动物数量的平均数乘以地块数);
(2)求抽取的样本
的相关系数(精确到0.01),并用相关系数说明各样区的这种野生动物的数量与植物覆盖面积的相关性.附:相关系数
.
您最近一年使用:0次
2024-02-21更新
|
317次组卷
|
5卷引用:陕西省咸阳市实验中学2021-2022学年高二下学期阶段性检测(一)数学(文)试题
陕西省咸阳市实验中学2021-2022学年高二下学期阶段性检测(一)数学(文)试题(已下线)8.1 成对数据的统计相关性(分层练习,5大题型)-2023-2024学年高二数学同步精品课堂(人教A版2019选择性必修第三册)(已下线)第八章 成对数据的统计分析(知识归纳+题型突破)-2023-2024学年高二数学单元速记·巧练(沪教版2020选择性必修第二册)(已下线)8.1.1变量的相关关系+8.1.2样本相关系数 第三课 知识扩展延伸(已下线)专题8.4 统计分析大题专项训练【六大题型】-2023-2024学年高二数学举一反三系列(人教A版2019选择性必修第三册)


