解题方法
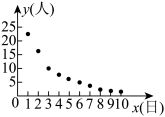
1 . 某市开展“安全随我行”活动,交警部门在某个交通路口增设电子抓拍眼,并记录了某月该路口连续10日骑电动摩托车未佩戴头盔的人数 与天数
与天数 的情况,对统计得到的样本数据
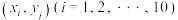 作了初步处理,得到下面的散点图及一些统计量的值.
表中 ,
, .
.
(1)依据散点图推断, 与
与 哪一个更适合作为未佩戴头盔人数与天数的回归方程类型?(给出判断即可,不必说明理由)
(2)依据(1)的结果和上表中的数据求出关于的回归方程.
(3)为了解佩戴头盔情况与性别的关联性,交警对该路口骑电动摩托车市民进行调查,得到如下列联表:
依据 的独立性检验,能否认为市民骑电动摩托车佩戴头盔与性别有关联?
参考公式: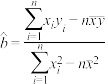 ,
, ,
, ,其中
,其中 .
.
与天数的情况,对统计得到的样本数据作了初步处理,得到下面的散点图及一些统计量的值. |  |  |  |  |  |
| 5.5 | 8.7 | 1.9 | 301 | 385 | 79.75 |
,.(1)依据散点图推断,
与哪一个更适合作为未佩戴头盔人数与天数的回归方程类型?(给出判断即可,不必说明理由)(2)依据(1)的结果和上表中的数据求出
关于的回归方程.(3)为了解佩戴头盔情况与性别的关联性,交警对该路口骑电动摩托车市民进行调查,得到如下列联表:
性别 | 佩戴头盔 | 合计 | |
不佩戴 | 佩戴 | ||
女性 | 8 | 12 | 20 |
男性 | 14 | 6 | 20 |
合计 | 22 | 18 | 40 |
的独立性检验,能否认为市民骑电动摩托车佩戴头盔与性别有关联?参考公式:
,,,其中. | 0.15 | 0.10 | 0.05 | 0.025 | 0.010 | 0.005 | 0.001 |
 | 2.072 | 2.706 | 3.841 | 5.024 | 6.635 | 7.879 | 10.828 |
您最近一年使用:0次
名校
2 . 使用统计手段科学预测传染病可以保障人民群众的生命健康.下表和散点图为某段时间内全球某传染病感染病例在第一次监测到之后数量随时间的变化,以时间为自变量(单位为天),以监测到的病例总数为因变量,选择以下两个回归模型拟合随的变化:回归模型一: ;回归模型二:
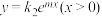 ,通过计算得出
 ,则下列说法正确的是( )
(单位为天),以监测到的病例总数为因变量,选择以下两个回归模型拟合随的变化:回归模型一:;回归模型二:,通过计算得出,则下列说法正确的是( ) | 1 | 5 | 7 | 12 | 16 | 20 |
| 2 | 9 | 12 | 29 | 63 | 101 |

A.使用回归模型一拟合的决定系数 大于使用回归模型二的决定系数 大于使用回归模型二的决定系数 |
| B.通过模型二得出的经验回归方程的预报效果好于通过模型一得出的经验回归方程 |
| C.在首例病例出现后45天,该传染病感染人数很有可能在200人左右 |
| D.在首例病例出现后45天,该传染病的感染人数很有可能超过10000人 |
您最近一年使用:0次
2024-06-03更新
|
820次组卷
|
2卷引用:广东省广州市华南师范大学附属中学2024届高三下学期5月月考数学试题
3 . 在推动电子制造业高质量发展的大环境下,某企业统筹各类资源,进行了积极的改革探索.下表是该企业每月生产的一种核心产品的产量 (件)与相应的生产总成本(万元)的四组对照数据.
企业研究人员建立了与的两种回归模型,利用计算机算得近似结果如下:
经验回归方程①: ;经验回归方程②:
 .
.
其中经验回归方程①的残差图如图所示(残差 观测值
观测值 预测值):关于的回归方程,并说明理由;
(2)从该企业在过去几年生产的该产品中随机抽取100件,优等品有60件,合格品有40件.每件优等品利润为20万元,每件合格品利润为15万元.若视频率为概率,该企业某月计划生产12件该产品,记优等品件数为 ,总利润为
,总利润为 .
.
(ⅰ)求与的关系式,并求 和
和 ;
;
(ⅱ)记该月的成本利润率 ,在(1)中选择的经验回归方程下,求的估计值.(结果保留2位小数)
附:成本利润率 .
.
(件)与相应的生产总成本(万元)的四组对照数据. | 5 | 7 | 9 | 11 |
| 200 | 298 | 431 | 609 |
与的两种回归模型,利用计算机算得近似结果如下:经验回归方程①:
;经验回归方程②:.其中经验回归方程①的残差图如图所示(残差
观测值预测值): 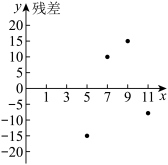
关于的回归方程,并说明理由; | 5 | 7 | 9 | 11 |
| 200 | 298 | 431 | 609 |
 |
(2)从该企业在过去几年生产的该产品中随机抽取100件,优等品有60件,合格品有40件.每件优等品利润为20万元,每件合格品利润为15万元.若视频率为概率,该企业某月计划生产12件该产品,记优等品件数为
,总利润为.(ⅰ)求
与的关系式,并求和;(ⅱ)记该月的成本利润率
,在(1)中选择的经验回归方程下,求的估计值.(结果保留2位小数)附:成本利润率
.
您最近一年使用:0次
解题方法
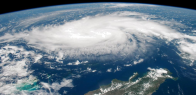
4 . 生成于大西洋的强烈热带气旋被称为飓风.中心风速178~209km/h对应于3级飓风,中心风速210~249km/h对应于4级飓风,中心风速超过250km/h对应于5级飓风.以下数据是大西洋流域从1921年到2010年每十年的主要飓风数量(含第3,4,5级).
(1)绘制“带平滑线和数据的散点图”;
(2)借助图象,尝试求出形如正弦型函数 的解析式;
的解析式;
(3)使用数学软件找到最佳拟合的正弦型函数.
时间/年 |
| 主要飓风数量 |
1921—1930 | 1 | 17 |
1931—1940 | 2 | 16 |
1941—1950 | 3 | 29 |
1951—1960 | 4 | 33 |
1961—1970 | 5 | 27 |
1971—1980 | 6 | 16 |
1981—1990 | 7 | 16 |
1991—2000 | 8 | 27 |
2001—2010 | 9 | 33 |
(2)借助图象,尝试求出形如正弦型函数
的解析式;(3)使用数学软件找到最佳拟合的正弦型函数.
您最近一年使用:0次
解题方法
5 . 1997~2006年中国的国内生产总值(GDP)的数据如下:
(1)作GDP和年份的散点图,根据该图猜想它们之间的关系可以用什么模型描述;
(2)建立年份为解释变量,GDP为响应变量的一元线性回归模型,并计算残差;
(3)根据你得到的一元线性回归模型,预测2017年的GDP,看看你的预测值与实际的GDP的误差是多少?(2017年GDP的实际值为 亿元)
亿元)
(4)你认为这个模型能较好地刻画GDP和年份的关系吗?请说明理由
(5)随着时间的发展,又收集到2007~2016年的GDP数据如下:
建立年份(1997~2016)为解释变量,GDP为响应变量的经验回归方程,并预测2017年的GDP,与实际的GDP误差是多少?你能发现什么?
年份 | GDP/亿元 | 年份 | GDP/亿元 |
1997 | 79715.0 | 2002 | 121717.4 |
1998 | 85195.5 | 2003 | 137422.0 |
1999 | 90564.4 | 2004 | 161840.2 |
2000 | 100280.1 | 2005 | 187318.9 |
2001 | 110863.1 | 2006 | 219438.5 |
(2)建立年份为解释变量,GDP为响应变量的一元线性回归模型,并计算残差;
(3)根据你得到的一元线性回归模型,预测2017年的GDP,看看你的预测值与实际的GDP的误差是多少?(2017年GDP的实际值为
亿元)(4)你认为这个模型能较好地刻画GDP和年份的关系吗?请说明理由
(5)随着时间的发展,又收集到2007~2016年的GDP数据如下:
年份 | GDP/亿元 | 年份 | GDP/亿元 |
2007 | 270232.3 | 2012 | 540367.4 |
2008 | 319515.5 | 2013 | 595244.4 |
2009 | 349081.4 | 2014 | 643974.0 |
2010 | 413030.3 | 2015 | 689052.1 |
2011 | 489300.6 | 2016 | 744127.2 |
您最近一年使用:0次
23-24高二上·上海·课后作业
解题方法
6 . 某公司随机调查了45户家庭,研究其一种产品的家庭人均消费量y与家庭人均月收入x之间的关系,得到的数据如下表所示.
(1)绘制变量y与x的散点图;
(2)计算y与x的相关系数;
(3)试分析研究y与x之间的线性回归关系.
| 家庭编号 | 家庭人均月收入x/元 | 家庭人均消费量y/元 |
| 1 | 5432 | 6.32 |
| 2 | 2336 | 3.52 |
| 3 | 3944 | 6.32 |
| 4 | 4656 | 21.60 |
| 5 | 9246 | 29.12 |
| 6 | 17512 | 76.00 |
| 7 | 8776 | 41.72 |
| 8 | 16624 | 54.80 |
| 9 | 14544 | 46.72 |
| 10 | 13600 | 41.68 |
| 11 | 5976 | 26.00 |
| 12 | 13144 | 25.28 |
| 13 | 3312 | 4.00 |
| 14 | 2832 | 1.36 |
| 15 | 10208 | 15.04 |
| 16 | 5960 | 6.16 |
| 17 | 3480 | 11.12 |
| 18 | 4320 | 4.48 |
| 19 | 6992 | 12.48 |
| 20 | 12344 | 42.24 |
| 21 | 8232 | 5.12 |
| 22 | 5680 | 32.00 |
| 23 | 6696 | 33.60 |
| 24 | 13984 | 39.04 |
| 25 | 11048 | 27.84 |
| 26 | 10040 | 21.04 |
| 27 | 14216 | 39.92 |
| 28 | 2960 | 4.72 |
| 29 | 9040 | 38.32 |
| 30 | 3704 | 4.08 |
| 31 | 6160 | 13.92 |
| 32 | 5792 | 32.80 |
| 33 | 6464 | 31.52 |
| 34 | 6320 | 6.68 |
| 35 | 6264 | 26.32 |
| 36 | 3248 | 3.52 |
| 37 | 9936 | 25.92 |
| 38 | 5264 | 17.12 |
| 39 | 13968 | 45.68 |
| 40 | 3744 | 5.12 |
| 41 | 8912 | 15.20 |
| 42 | 3304 | 4.08 |
| 43 | 14296 | 66.64 |
| 44 | 11960 | 40.88 |
| 45 | 12208 | 31.44 |
(2)计算y与x的相关系数;
(3)试分析研究y与x之间的线性回归关系.
您最近一年使用:0次
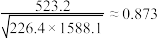
7 . 为了解某市高中男生身高与体重的关系,随机抽取5所高中学校,并获得这些学校全部男生的身高(单位:cm)与体重(单位:kg)的数据.为了减少篇幅,从中随机选取10名高中男生的身高与体重的数据,如表所示.试根据表中数据绘制散点图,计算相关系数并判断学生身高与体重的相关程度..
10名高中男生的身高与体重如下表:
附:相关系数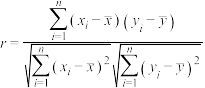 ,
,
10名高中男生的身高与体重如下表:
| 编号 | 1 | 2 | 3 | 4 | 5 | 6 | 7 | 8 | 9 | 10 |
| 身高/cm | 174 | 176 | 176 | 181 | 182 | 179 | 169 | 168 | 171 | 180 |
| 体重/kg | 55 | 58 | 62 | 74 | 88 | 68 | 54 | 52 | 56 | 86 |
,
您最近一年使用:0次
8 . 为了研究豆类脂肪含量与其产生的热量的关系,选取了5种豆类进行实验测定.下面是 kg豆类中脂肪含量(单位:kg)与相应热量(单位:kJ)的对照表.
(1)根据表中的数据绘制散点图;
(2)观察散点图的趋势,如果能看成线性关系,请在图中画出一条直线来近似的表示这种关系,并计算豆类脂肪含量与热量的相关系数.
kg豆类中脂肪含量(单位:kg)与相应热量(单位:kJ)的对照表.| 豆类 | 黄豆 | 豇豆 | 青毛豆 | 豌豆(鲜) | 四季豆 |
| 脂肪含量/kg | 0.0184 | 0.0002 | 0.0057 | 0.0003 | 0.0004 |
| 热量/kJ | 1726 | 108 | 527 | 336 | 130 |
(2)观察散点图的趋势,如果能看成线性关系,请在图中画出一条直线来近似的表示这种关系,并计算豆类脂肪含量与热量的相关系数.
您最近一年使用:0次
解题方法
9 . 随着网络的普及,网上购物的方式己经受到越来越多年轻人的青睐,某家网络店铺商品的成交量(单位:件)与店铺的浏览量(单位:,次)之间的对应数据如下表所示:
(1)根据表中数据画出散点图;
(2)根据表中数据求出关于的线性回归方程;
(3)当这种商品的成交量突破100件(含100件)时,预测这家店铺的浏览量至少为多少.
(单位:件)与店铺的浏览量(单位:,次)之间的对应数据如下表所示:
| 1 | 3 | 5 | 7 | 9 |
| 10 | 30 | 40 | 50 | 60 |
(2)根据表中数据求出
关于的线性回归方程;(3)当这种商品的成交量突破100件(含100件)时,预测这家店铺的浏览量至少为多少.
您最近一年使用:0次
解题方法
10 . 学生的学习除了在课堂上认真听讲,还有一个重要环节就是课后自主学习,人们普遍认为课后自主学习时间越多学习效果越好.某权威研究机构抽查了部分高中学生,对学生每天花在数学上的课后自主学习时间(分钟)和他们的数学成绩(分)做出了调查,得到一些数据信息并证实了与正相关.“学霸”小李为了鼓励好朋友小王和小张努力学习,拿到了该机构的一份数据表格如下(其中部分数据被污染看不清),小李据此做出了散点图如下,并计算得到 ,
, ,
, 的方差为350,
 的相关系数
的相关系数 (
( ).
).
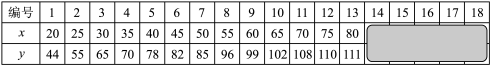

(1)请根据所给数据求出 的线性经验回归方程,并由此预测每天课后自主学习数学时间达到100分钟时的数学成绩;
(2)受到小李的鼓励,小王和小张决定在课后花更多的时间在数学学习上,小张把课后自主学习时间从20分钟增加到60分钟,而小王把课后自主学习时间从60分钟增加到100分钟.经过几个月的坚持,小张的数学成绩从50分提升到90分,但小王的数学成绩却只是从原来的100分提升到了115分.小王觉得很迷惑,课后学习时间每天同样增加了40分钟,为什么自己的成绩仅仅提升了十几分呢,为什么实际成绩跟预测的成绩差别那么大呢?
①请根据你对课后自主学习时间与数学成绩的关系的看法及对一元回归模型的理解,解答小王的疑惑;
②小李为了解答小王的疑惑,想办法拿到了上表中被污染的数据如下.据此,请在上图中补齐散点图,并给出一个合适的经验回归方程类型(不必求出具体方程,不必说明理由).
附:回归方程 中斜率和截距的最小二乘估计公式分别为
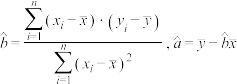 .
.
分钟)和他们的数学成绩(分)做出了调查,得到一些数据信息并证实了与正相关.“学霸”小李为了鼓励好朋友小王和小张努力学习,拿到了该机构的一份数据表格如下(其中部分数据被污染看不清),小李据此做出了散点图如下,并计算得到,,的方差为350,的相关系数(). (1)请根据所给数据求出
的线性经验回归方程,并由此预测每天课后自主学习数学时间达到100分钟时的数学成绩;(2)受到小李的鼓励,小王和小张决定在课后花更多的时间在数学学习上,小张把课后自主学习时间从20分钟增加到60分钟,而小王把课后自主学习时间从60分钟增加到100分钟.经过几个月的坚持,小张的数学成绩从50分提升到90分,但小王的数学成绩却只是从原来的100分提升到了115分.小王觉得很迷惑,课后学习时间每天同样增加了40分钟,为什么自己的成绩仅仅提升了十几分呢,为什么实际成绩跟预测的成绩差别那么大呢?
①请根据你对课后自主学习时间与数学成绩的关系的看法及对一元回归模型的理解,解答小王的疑惑;
②小李为了解答小王的疑惑,想办法拿到了上表中被污染的数据如下.据此,请在上图中补齐散点图,并给出一个合适的经验回归方程类型(不必求出具体方程,不必说明理由).
编号 | 14 | 15 | 16 | 17 | 18 |
x | 85 | 90 | 100 | 110 | 120 |
y | 113 | 114 | 117 | 119 | 119 |
中斜率和截距的最小二乘估计公式分别为.
您最近一年使用:0次


