生物节律是描述体温、血压和其他易变的生物变化的每日生物模型.下表中给出了在24h期间人的体温的典型变化(从夜间零点开始计时).
(1)作出这些数据的散点图;
(2)选用一个三角函数来近似描述这些数据;
(3)在散点图中作出(2)中所选函数的图象.
| 时间 | 0 | 2 | 4 | 6 | 8 | 10 | 12 | 14 | 16 | 18 | 20 | 22 | 24 |
| 温度 | 36.8 | 36.7 | 36.6 | 36.7 | 36.8 | 37.0 | 37.2 | 37.3 | 37.4 | 37.3 | 37.2 | 37.0 | 36.8 |
(2)选用一个三角函数来近似描述这些数据;
(3)在散点图中作出(2)中所选函数的图象.
21-22高一上·全国·课后作业 查看更多[1]
(已下线)5.7三角函数的应用(基础知识+基本题型)--【一堂好课】2021-2022学年高一数学上学期同步精品课堂(人教A版2019必修第一册)
更新时间:2022-03-11 08:40:28
|
相似题推荐
解答题-作图题
|
较易
(0.85)
名校
【推荐1】已知函数 ,直线
,直线 是其图象的一条对称轴.
(1)求 的值;
的值;
(2)用五点作图法画出函数 在区间
在区间 上的图象,并由此写出函数在上的单调减区间.
,直线是其图象的一条对称轴.(1)求
的值;(2)用五点作图法画出函数
在区间上的图象,并由此写出函数在上的单调减区间.
您最近一年使用:0次
解答题-作图题
|
较易
(0.85)
名校
【推荐2】已知函数 的最大值为
的最大值为 ,其图象相邻两条对称轴之间的距离为
(1)求函数 的解析式
的解析式
(2)将的图象向右平移 个长度单位,再向下平移
 个长度单位,再将图象上所有点横坐标变为原来的一半,得到
 的图象,用“五点法”作出在
 内的大致图象.
的最大值为,其图象相邻两条对称轴之间的距离为(1)求函数
的解析式(2)将
的图象向右平移个长度单位,再向下平移个长度单位,再将图象上所有点横坐标变为原来的一半,得到的图象,用“五点法”作出在内的大致图象.
您最近一年使用:0次
解答题-问答题
|
较易
(0.85)
【推荐3】某同学在研究函数 的图象与性质时,采用“五点法”画简图列表如下:
(1)根据上表中数据,求出 及
及 的值;
的值;
(2)求函数 的单调递减区间.
的图象与性质时,采用“五点法”画简图列表如下:
|
|
|
|
|
|
|
|
|
|
|
|
|
|
|
|
|
|


 及的值;
及的值;(2)求函数
的单调递减区间.
您最近一年使用:0次
解答题-问答题
|
较易
(0.85)
【推荐1】函数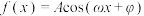 (
( ,
, ,
, )的部分图象如图.

(1)求函数 的解析式;
的解析式;
(2)将函数上的每个点的纵坐标不变,横坐标变为原来的 倍,再将所得图象向右平移
 个单位长度,得到函数
 的图象.已知函数
 若函数
若函数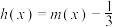 的零点从左到右依次为
 ,
, ,…,
,…, ,求
,求 的值,并求
的值,并求 的值.
的值.
(,,)的部分图象如图.(1)求函数
的解析式;(2)将函数
上的每个点的纵坐标不变,横坐标变为原来的倍,再将所得图象向右平移个单位长度,得到函数的图象.已知函数若函数的零点从左到右依次为,,…,,求的值,并求的值.
您最近一年使用:0次
解答题-问答题
|
较易
(0.85)
【推荐2】如图是一弹簧振子做简谐振动的图像,横轴表示振动的时间,纵轴表示振子的位移.

求:(1)简谐振动的函数解析式;
(2)在时间为 时的位移.
时的位移.
求:(1)简谐振动的函数解析式;
(2)在时间为
时的位移.
您最近一年使用:0次
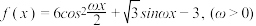 ,该函数在一个周期内的图象如图所示,A为图象的最高点,B、C为图象与x轴的交点,且△ABC为正三角形.
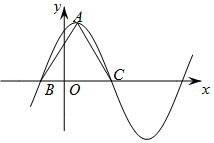
 ,
, ,求
,求 的值.
的值.
解答题-问答题
|
较易
(0.85)
【推荐1】已知函数 .
.
(1)求的最小正周期和单调递增区间.
(2)当 时,求的最值.
.(1)求
的最小正周期和单调递增区间.(2)当
时,求的最值.
您最近一年使用:0次
解答题-作图题
|
较易
(0.85)
【推荐2】设 ,函数
,函数 (其中
(其中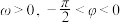 )的最小正周期为
 ,且
,且 .
.
(1)求 和的值;
和的值;
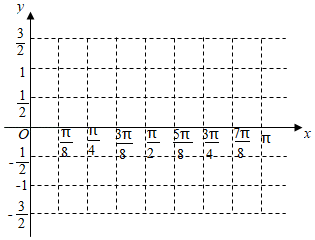
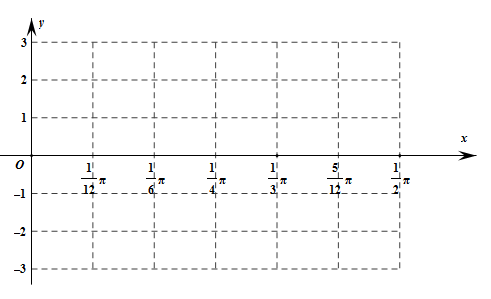
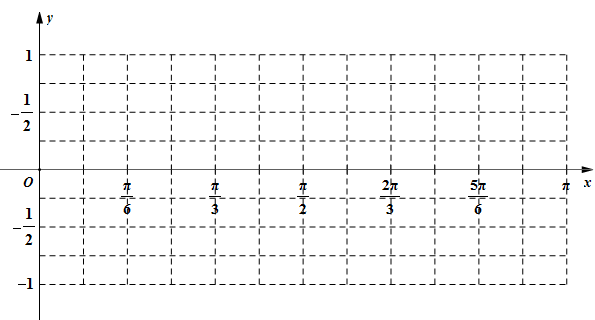
(2)在给定的坐标系中作出函数在上的图象;
(3)根据(2)的图象,写出 时,
时, 的取值范围.
,函数(其中)的最小正周期为,且.(1)求
和的值;(2)在给定的坐标系中作出函数
在上的图象;(3)根据(2)的图象,写出
时,的取值范围.
您最近一年使用:0次
 的图象相邻两个对称轴之间的距离为
 ,且
,且 的图象与
的图象与 的图象有一个横坐标为
 的交点
的交点 时,求
时,求
解答题-作图题
|
较易
(0.85)
解题方法
【推荐1】某商场经营某种商品,在某周内获纯利 (元)与该周每天销售这种商品数之间的一组数据关系如表:
(1)画出散点图;
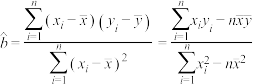
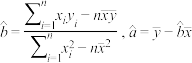
(2)求纯利与每天销售件数之间的回归直线方程;
(3)估计当每天销售的件数为 件时,每周内获得的纯利为多少?
参考数据: ,
, ,
, ,
, ,
, ,
, .
.
(元)与该周每天销售这种商品数之间的一组数据关系如表:
|
|
|
|
|
|
|
|
|
|
|
|
|
|
|
|


(2)求纯利
与每天销售件数之间的回归直线方程;(3)估计当每天销售的件数为
件时,每周内获得的纯利为多少?参考数据:
,,,,,.
您最近一年使用:0次
解答题-作图题
|
较易
(0.85)
解题方法
【推荐2】为推进北方地区冬季清洁取暖,国家发改委制定了煤改气、煤改电价格扶植新政策,从而使得煤改气、煤改电用户大幅度增加,下面条形图(图1)反映了某省2020年1~7月份煤改气、煤改电的用户数量(单位:万户).
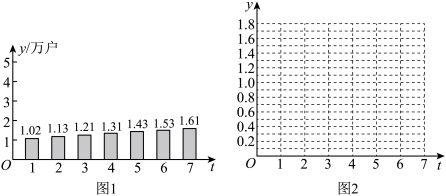
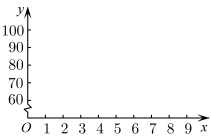
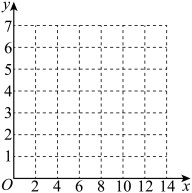
(1)在给定坐标系(图2)中作出煤改气、煤改电用户数量y随月份t变化的散点图,并用相关系数说明y与t之间具有线性相关性;
(2)建立y关于t的回归直线方程(系数精确到0.01),并预测11月份该省煤改气、煤改电的用户数量.
参考数据: ,
, ,
,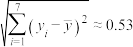 ,
,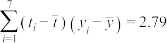 ,
, .
.
(1)在给定坐标系(图2)中作出煤改气、煤改电用户数量y随月份t变化的散点图,并用相关系数说明y与t之间具有线性相关性;
(2)建立y关于t的回归直线方程(系数精确到0.01),并预测11月份该省煤改气、煤改电的用户数量.
参考数据:
,,,,.
您最近一年使用:0次

 )
)


